Little Value Investor
LVI: Energy Sector Price to EPS Peer Comparison
Mark Goh
Publish date: Wed, 02 Mar 2022, 01:46 PM
All the craze in the world on energy sector with price of brent crude reaching to record levels.
Following my previous post on LVI: Semiconductor Peer Sector Price to EPS, it would be interesting to look at our local energy sector stocks under same methodology. You can read the methodology in the link above.
I filtered all stocks that are under 'oil & gas procuders', 'energy infrastructure' and 'equipment & services' subsectors in the entire Bursa. The result is it include all the following component stocks:
BARAKAH, YINSON, OVH, ARMADA, RL, PETRONM, DIALOG, HIBISCS, ICON, COASTAL, CARIMIN, DELEUM, PENERGY, HENGYUAN, T7GLOBAL, UZMA, THHEAVY, DAYA, SCOMI, SCOMIES, SUMATEC, VELESTO, HANDAL, SERBADK, REACH, MHB, WASEONG, DAYANG, SAPNRG, PERDANA, ALAM
As oppose to the semiconductor methodology, if I remove all stocks with net loss in any of the last 20 ttm results then I will be left with very little statistical sources. So I decided to keep all of them except with a negative average net loss. This render me with the following counters:
YINSON, PETRONM, DIALOG, HIBISCS, CARIMIN, DELEUM, HENGYUAN, T7GLOBAL, UZMA, SUMATEC, DAYANG
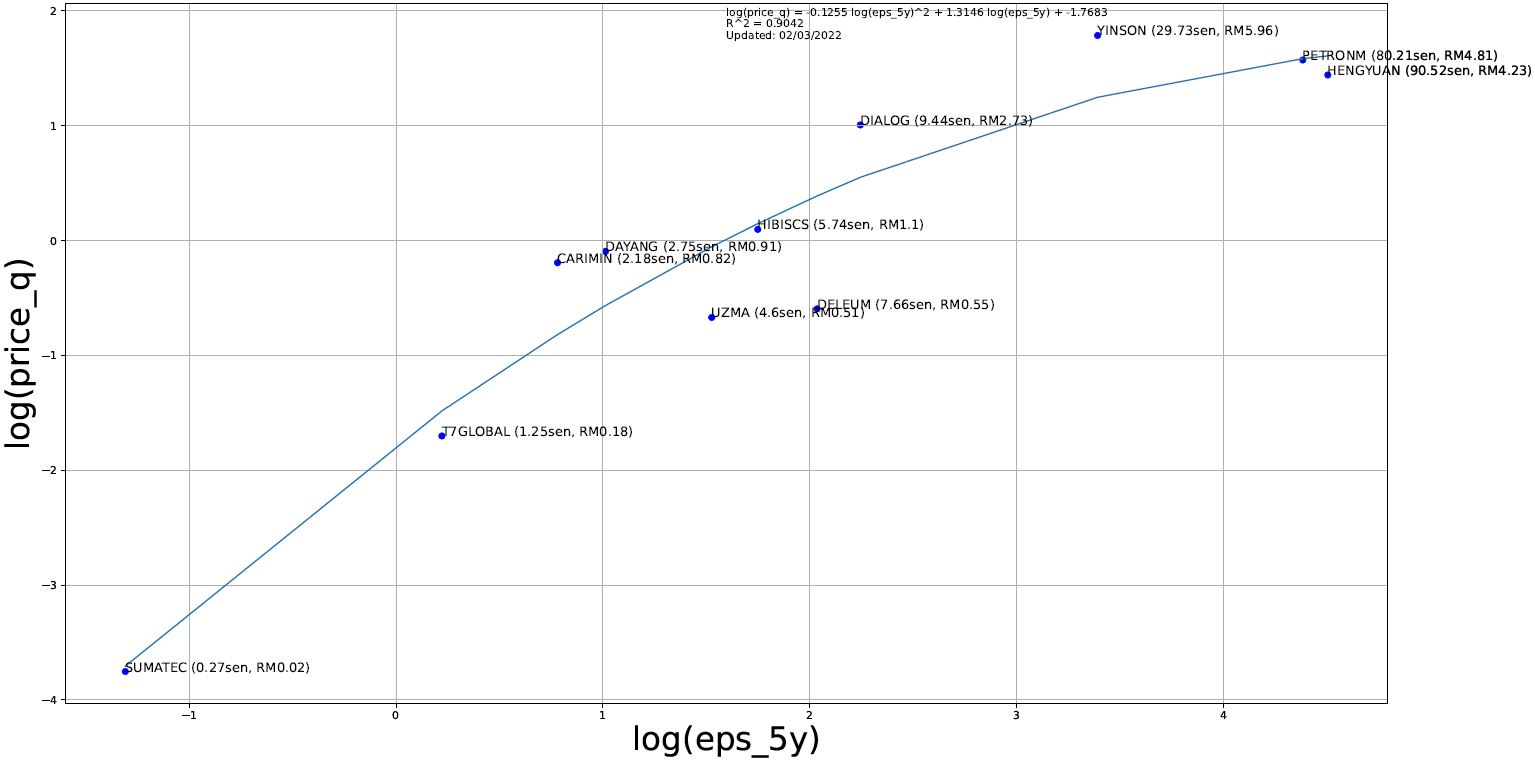
And plot price and eps on a log scale.
Here is what I received:

Caption: Please right click and view the image in another tab.[it looks distorted in this post]
The linear regression line an R squared of 0.90 which is very good. (Correction: in the previous post that I fitted a polynomial best fit line not a linear one)
From here, all stocks that are below the line are trading at relatively undervalue and above the sector are stocks that are overvalue. I need to stress the word relatively because there are some companies that deserve a lower valuation and some deserve a higher valuation.
I am not interested in the energy sector due to its highly cyclical nature (maybe I will make an exception for Dialog) but hope this at least helps retail investors that do.
Thank you
More articles on Little Value Investor
LVI: Food & Beverages Sector Price to EPS Peer Comparison (and economic moat)
Created by Mark Goh | Mar 11, 2022
Discussions
Be the first to like this. Showing 1 of 1 comments


pokerpro88
thanks Mark...very informative!
2022-03-03 12:32