


Little Value Investor
LVI: Food & Beverages Sector Price to EPS Peer Comparison (and economic moat)

Mark Goh
Publish date: Fri, 11 Mar 2022, 12:16 PM
Mark Goh
0 10
Little Value Investor is my public (but also personal) archive of my investing ideas so that I can look back at my previous self to reflect.
I have been investing starting in 2016 when my bestfriend convinced me to invest. Mostly self thought, my early journey have been binge watching Professor's Damodaran NYU Stern University's semester classes on Valuation. Now, in my free time I read announcements, quarterly and annual reports.
I have been investing starting in 2016 when my bestfriend convinced me to invest. Mostly self thought, my early journey have been binge watching Professor's Damodaran NYU Stern University's semester classes on Valuation. Now, in my free time I read announcements, quarterly and annual reports.
In 1995, Warren Buffett during the Berkshire's AGM was asked what is the economic principles he follow. During that AGM he introduced the concept of 'economic moat' to the value investing community and the years after it took over from there. I am not a value investing expert in any way close to others let alone Warren himself but I try aspire to understand concepts of value investing.
Economic moat in Warren's speech:
But what you’re trying to — what we’re trying to find is a business that, for one reason or another — it can be because it’s the low-cost producer in some area, it can be because it has a natural franchise because of surface capabilities, it could be because of its position in the consumers’ mind, it can be because of a technological advantage, or any kind of reason at all, that it has this moat around it.
I asked myself if I could quantify and distill economic moat of a company into a fundamental ratio, number, or score. I don't think I could do it and I will not attempt to do it so what is the next best thing? I think I found 'my way' of quantifying one of the consequences of good economic moat - which is a product of net profit margin sortino ratio and a long term revenue growth adjusted for downside risks (abbreviated NPmRevLTDRACAGR). For this ratio to be produced the company need to have adequate QR report that could allow a realiable indication of extrapolating their performance into the future - so all companies with less than 5 years of report will be excluded. NOTE: I do not know this to be a fact - but only attempt to draw a hypothesis. You decide if I am wrong or right.
Going back to the Food & Beverages sector, I did my old price to eps peer comparison plot (as I have done for property, semiconductor, energy, and plantation) but this time adding a 3rd parameter (as I mentioned above) represented by the color and the marker size of the scatter plot.
The result:
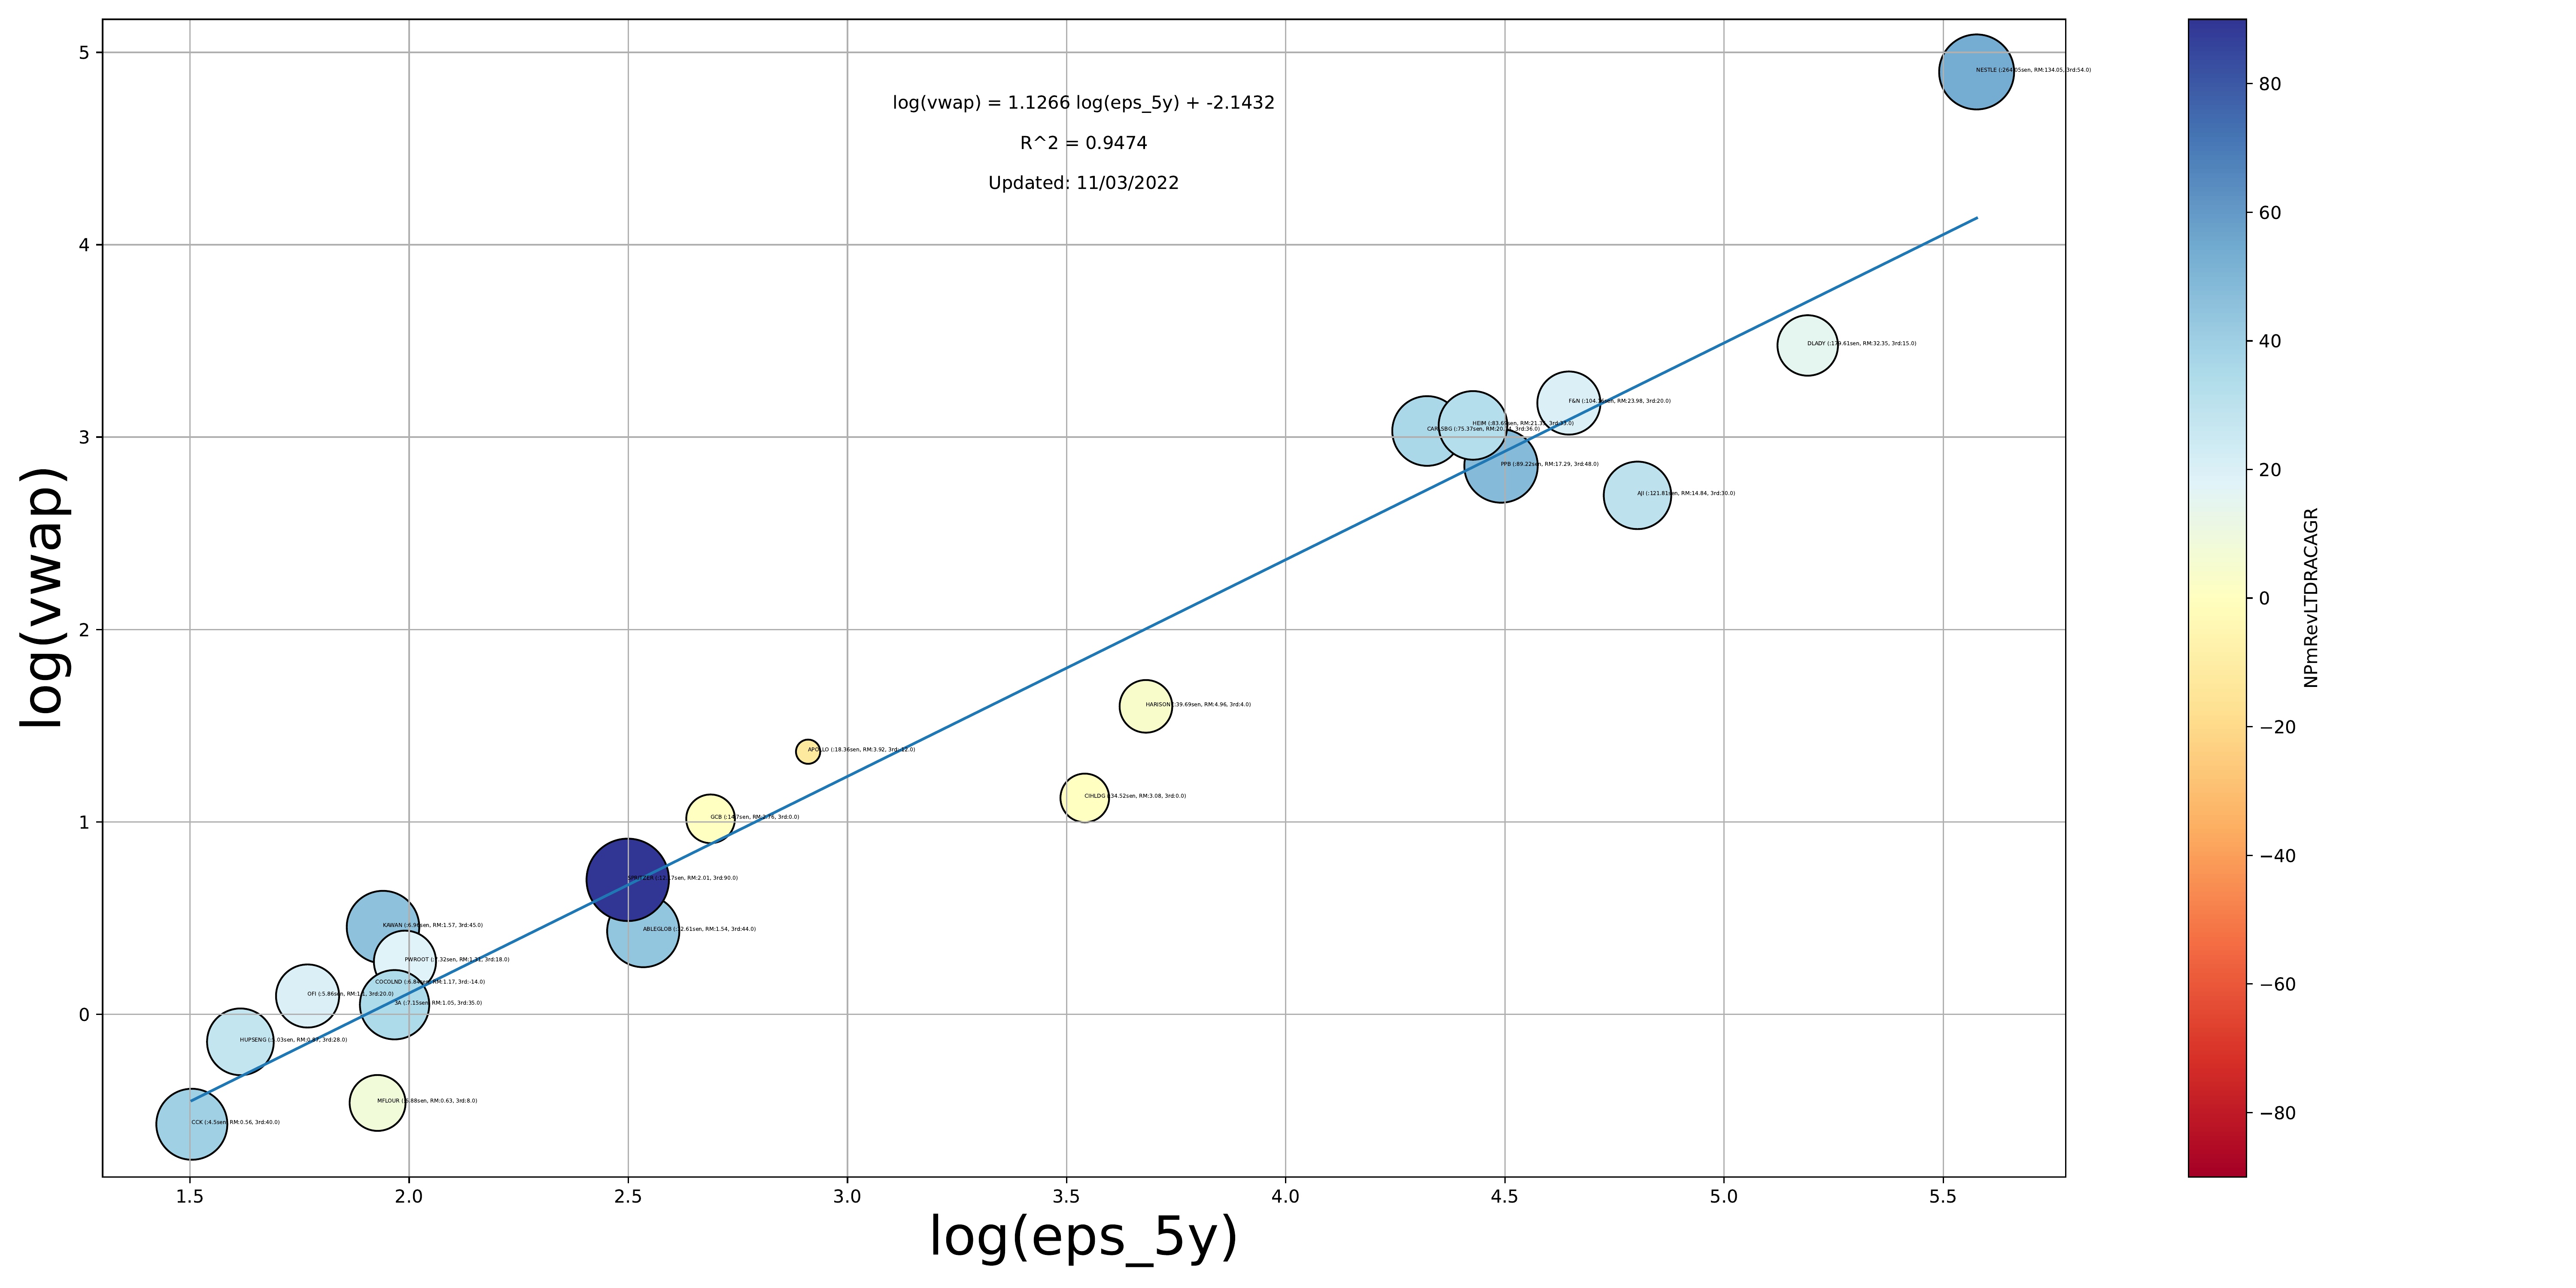
Note: You need to right click and download this time and zoom in to read the annotations of each stock name.
How to read it?
1. R2 of 0.94 is pretty indicative that stocks in these sector are fairly valued versus their peers that they do not deviate too much from the linear regression line.
2. Stocks above the line along the y-axis are generally considered overvalued and below are considered undervalued.
3. NPmRevLTDRACAGR, higher the score (the bluer the color) the better. If a stock with a ratio of 0 I would consider as neutral and red would be considered negative past performance (but not necessarily so). As a point for clarification, high score (or blue plot) means that in the last 10 years their Net profit margin have shown to be resilient with little downward volatility and that the Revenue have shown a positive growth over the long run. The product of these 2 (NPmargin resilience x Revenue growth) will output a positive number.
DISCLAIMER: Now if you come across a stock with high Net Profit margin resilience but the revenue have trending down it is not necessarily a bad thing. It may be that the company is transitioning to a low volume (hence lower revenue product) but with high net profit margin.
Some interesting observations:
1. Nestle (along with AJI, F&N, HEIM, CARLSBG, PPB and DLADY) is at the top-right and it made sense for them to be there being high average 5y eps renders it fitting to have high VWAP (volume weighted average price). AJI is significantly below the trendline can be considered undervalued compared to peers in similar group.
2. There is also the bottom-left of the plot namely (CCK, MFLOUR, HUPSENG, OFI, 3A, COCOLND, PWROOT, and KAWAN) which companies are in the VWAP range of RM0.56-RM1.57 and 5y eps of 4.5sen-7.32sen). These group are also closely clustered around the trendline which means there isn't a big gap of how they are priced in the market relative to its peers.
3. MFLOUR is notably trading at relatively cheap RM0.63 VWAP at an EPS of 6.88sen which is similar to 3A, COCOLND, PWROOT and KAWAN. Which makes MFLOUR relatively undervalued.
4. SPRITZER, by the third parameter (NPmRevLTDRACAGR) is the best historical performing stock here with a score of 90.0. I will be looking into why that is.
Hope this helps with your selection of any food and beverage stocks you might have. Interested to read any other conclusion that you may draw from my analysis - please put them in the comment below.
More articles on Little Value Investor
Featured Posts


Latest Videos


Apps


Top Articles
1
2
BFM Podcast
3
MQ Market Updates
4
TA Sector Research
5
BFM Podcast
6
BFM Podcast
7
PublicInvest Research
8
#
Stock
Score
Daily Stocks
Stock Name
Last
Change
Volume
Stock Name
Last
Change
Volume
Stock Name
Last
Change
Volume
MQ Trading Signals
Stock
Time
Signal
Duration
Stock
Time
Signal
Duration
Featured Advertisers / Partners


Ride The Bull Short The Bear
CS Tan
4.9 / 5.0
This book is the result of the author's many years of experience and observation throughout his 26 years in the stockbroking industry. It was written for general public to learn to invest based on facts and not on fantasies or hearsay....