FFB: Positioned for a New High? - KingKKK
KingKKK
Publish date: Tue, 10 Sep 2024, 09:53 AM

Overall technical outlook:
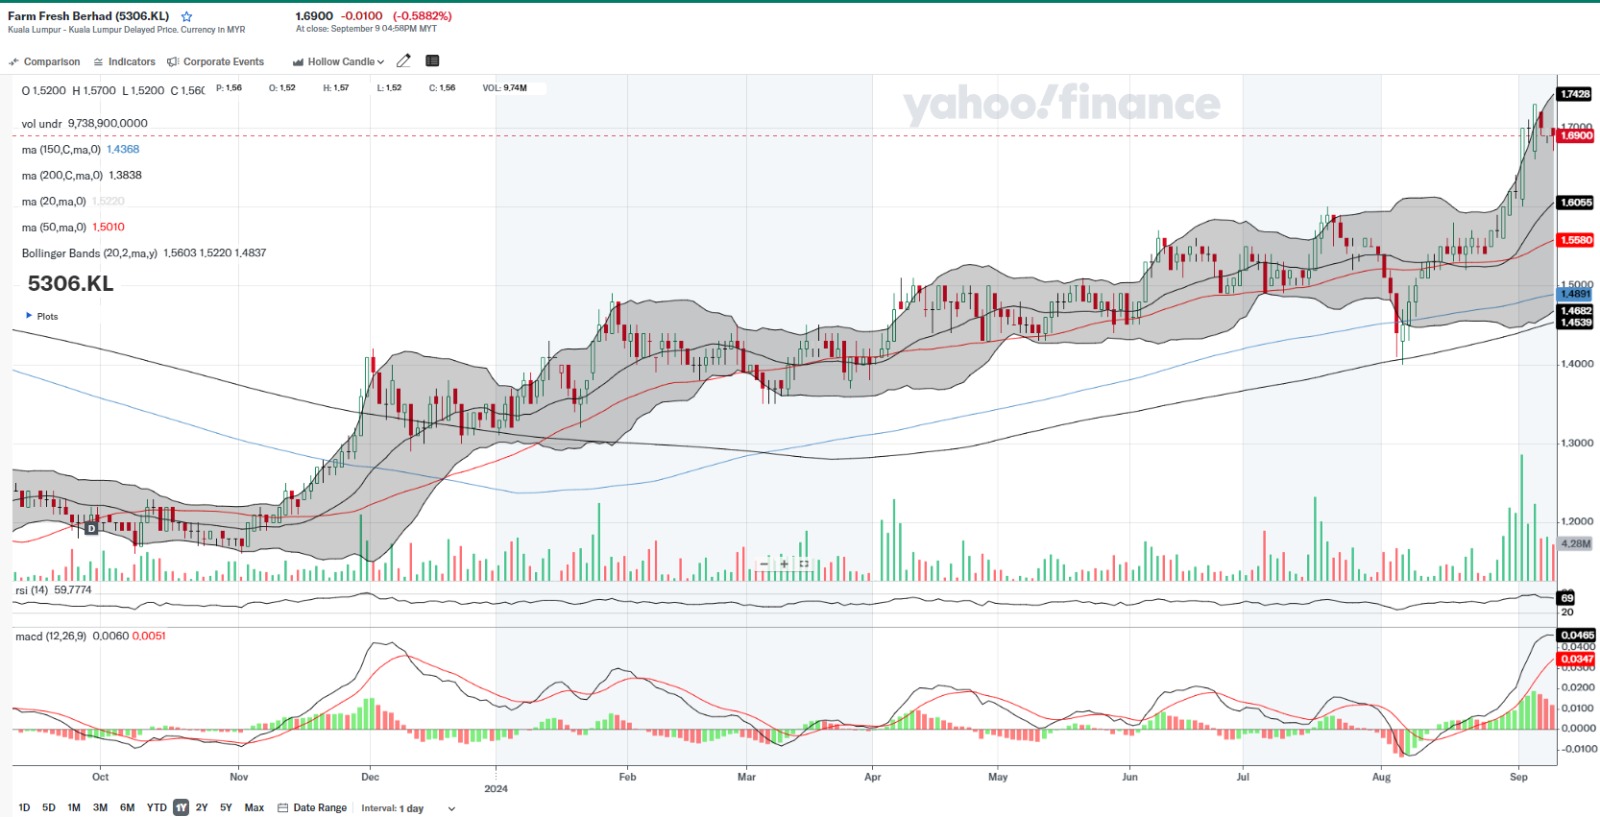
FFB shows a strong uptrend with favorable indicators, but the position near the upper Bollinger Band suggests the potential for short-term consolidation or a pullback before resuming upward momentum.
Bollinger Bands:
The price is currently trading near the upper band, indicating strength but also potential overextension. This suggests bullish momentum, but caution is warranted for a potential pullback.
Moving Averages:
The price is above the 50-day moving average (MA), which is currently at 1.50, and the 200-day MA, which is at 1.38. This indicates a strong uptrend.
The 150-day MA at 1.43 acts as a support level that has been respected, reinforcing the bullish trend.
Volume, MACD (Moving Average Convergence Divergence) and RSI (Relative Strength Index):
FFB: Positioned for a New High? - KingKKK’s Substack
My other posts:
Unveiling Market Gems: Your Guide to Beating the Market (substack.com)
MRCB: Bouncing Back - Can It Sustain The Recent Momentum? (substack.com)
Econpile: Double Bottom or Bullish Engulfing? (substack.com)
MALAKOF: Uptrend Continuation With Potential MACD Crossover? (substack.com)
MAGNI-Tech on the rise, is a Major Breakout Brewing? (substack.com)
IHH Healthcare: An Uptrend Defensive Stock (substack.com)
IGBREIT: An Uptrend REIT To Weather The Storm (substack.com)
KLCC - A Deep Dive Into the Chart's Next Move (substack.com)
More articles on Stock Market Enthusiast


Created by KingKKK | Feb 01, 2025

Created by KingKKK | Jan 31, 2025


Created by KingKKK | Jan 23, 2025

Created by KingKKK | Jan 22, 2025


