


fundamental and technical analysis
KESM fundamental and technical analysis

Brian Loke
Publish date: Wed, 10 Aug 2016, 11:31 AM
Fundamental Analysis:
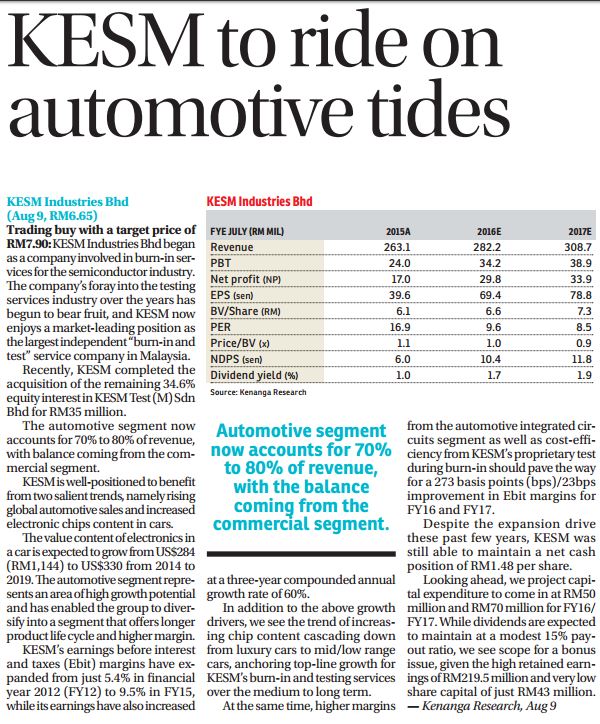
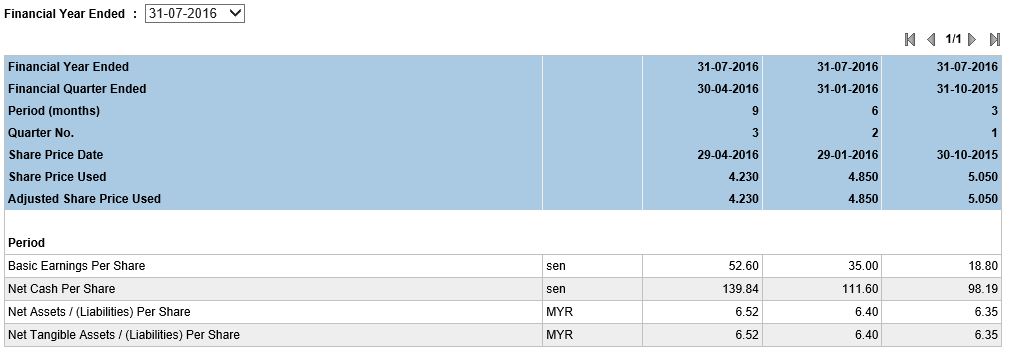
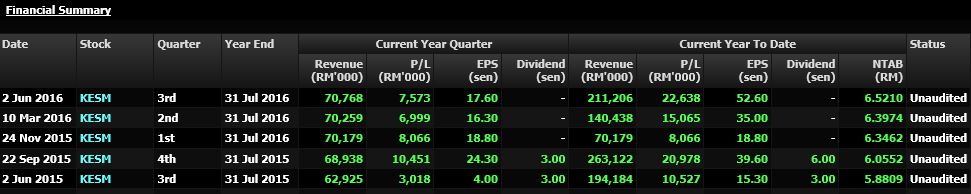
KESM revenue and profit continue to grow higher with its latest outstanding 3rd Quarter earning which is doubled last year Q3
I am expecting higher dividend payout at 4th quarter with the continue strong USD.
It also has strong balance sheet, net cash 139 cents per share and also higher NTA.
Technical analysis:
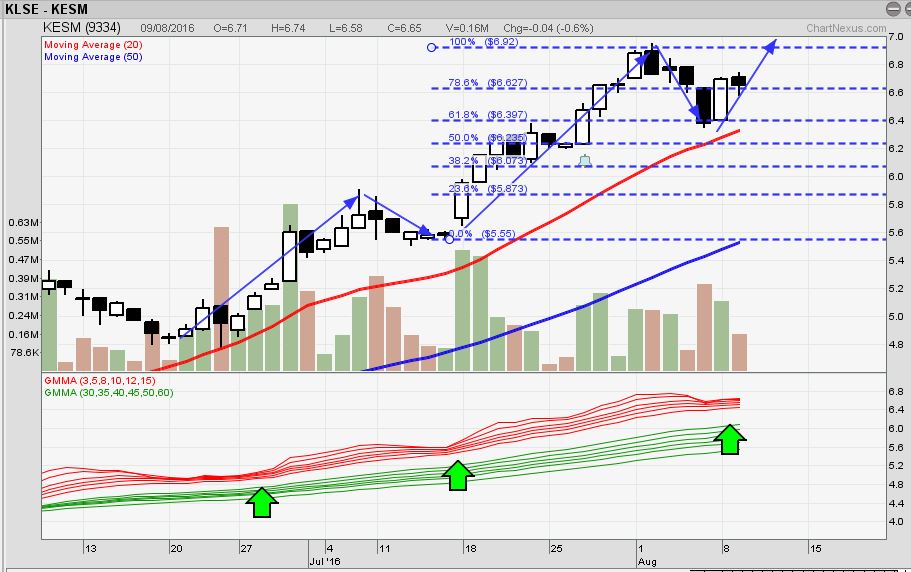
KESM stock price at strong uptrend with moving average above 20 days and 50 days and just broke historical high.
Elliotte wave shows increasing momentum with 3rd wave is stronger than 1st wave.
Its stock price just completed Fibonacci retracement at 61.8% (rm6.4) which formed its support.
GMMA with green arrow shows it is starting to have trend breaking out from compressing phase.
Target price at around rm7.90.
Related Stocks
| Chart | Stock Name | Last | Change | Volume |
|---|
Market Buzz
More articles on fundamental and technical analysis
Discussions
1 person likes this. Showing 5 of 5 comments
when u compare their charts, KESM is at much stronger and just broke historical high
2016-08-10 15:31
Post a Comment
Featured Posts
Introducing MY's First IPO Fund for Sophisticated Investors!
New Update. Discover investment communities that resonate with your ideas
M & A Value Partners IPO Equity Fund has been launched - Targeted 13% Return p.a
Latest Videos


Apps


Top Articles
1
Stock Market Enthusiast
2
3
save malaysia!
4
Good Articles to Share
Taiwan warns law changes may have ‘serious impacts’ on budget
5
Good Articles to Share
Gold extends gains as US inflation data ease rate cut worries
6
Good Articles to Share
UnitedHealth CEO murder suspect faces terrorism charges in New York
7
Good Articles to Share
8
Good Articles to Share
#
Stock
Score
Daily Stocks
Stock Name
Last
Change
Volume
Stock Name
Last
Change
Volume
Featured Advertisers / Partners


Ride The Bull Short The Bear
CS Tan
4.9 / 5.0
This book is the result of the author's many years of experience and observation throughout his 26 years in the stockbroking industry. It was written for general public to learn to invest based on facts and not on fantasies or hearsay....
UY
noted, thanks
2016-08-10 11:43