


Candlestick & Breakout Patterns
PESONA Rounding Bottom Hitting Neckline With Strong Resistance - 3 Possible Scenarios Inside

Ming Jong Tey
Publish date: Mon, 26 Dec 2016, 05:06 PM
Ming Jong Tey
0 68
Understand the psychology behind the candlestick & breakout pattern will give you an edge to realize why the market does what it does and anticipate opportunities before they happen!
Get notified on The Next Best Trading & Investing Ideas for free:
Visit ==> http://www.vipplatform.com/lp/ideas/
"Like" FB Page ==> https://www.facebook.com/BursaSGXcandlestick/
"Join" Telegram Channel ==> https://t.me/BursaSGXCandlestick
Get notified on The Next Best Trading & Investing Ideas for free:
Visit ==> http://www.vipplatform.com/lp/ideas/
"Like" FB Page ==> https://www.facebook.com/BursaSGXcandlestick/
"Join" Telegram Channel ==> https://t.me/BursaSGXCandlestick
PESONA (8311): Bullish
Pattern: Rounding Bottom Pending Breaks Up
As shown in the weekly chart below, Pesona has formed a beautiful rounding bottom pattern, which takes about 1.5 years.
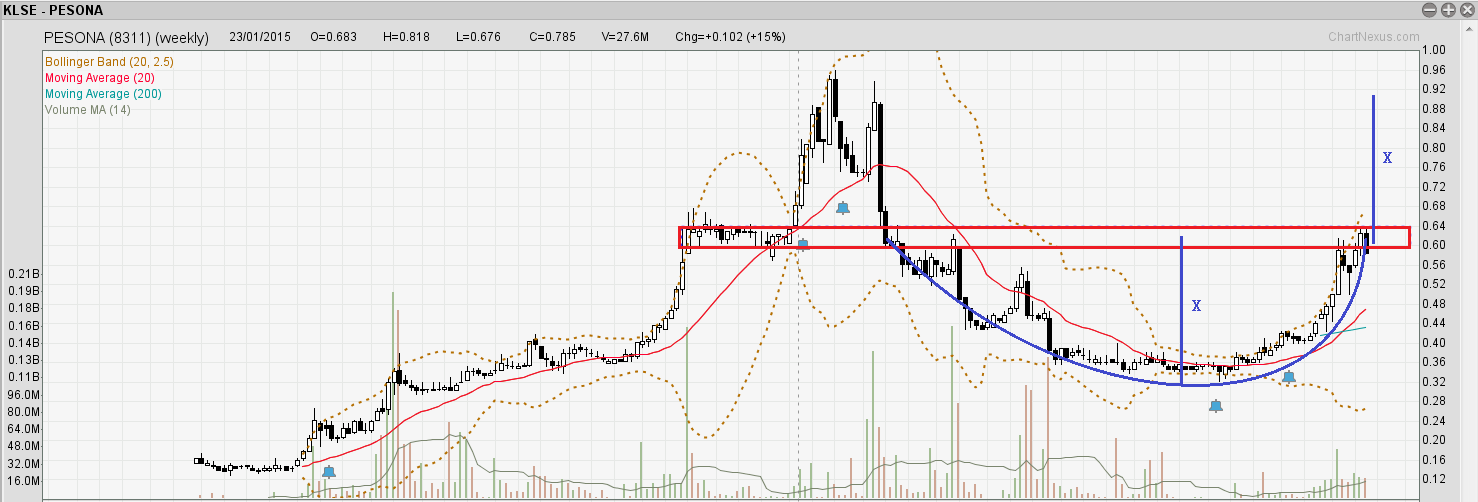
It hits the neckline, which corresponds to a strong resistance area as highlighted in the red rectangle. Last week bearish engulfing price action suggests losing bullish momentum.
Based on the projection (X) of the rounding bottom structure, the target price is around 0.88.
On the daily chart below, the price attempted twice to penetrate the resistance area (0.6-0.64) but did not succeed.
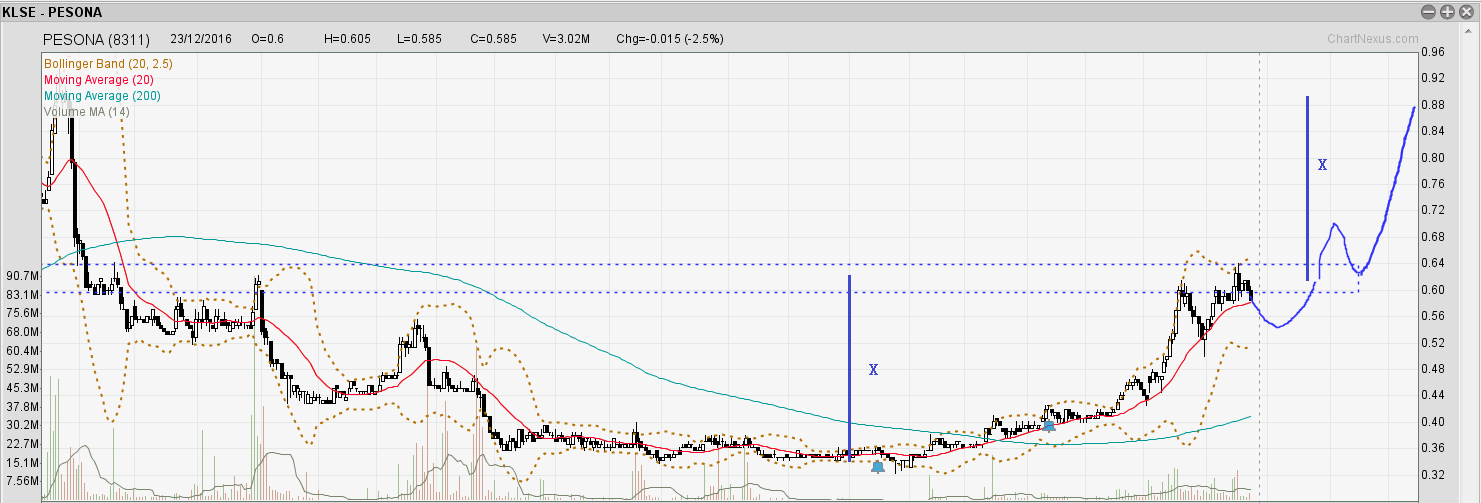
I assume 3 scenarios going on from now:
- Price makes a pullback before attempting to break the resistance area, as shown in the daily chart above.
- Price hovers around 0.58-0.64 region to resume bullish momentum to hit the first target price of 0.88.
- Price breaks up without consolidating and heads toward the target price.
My preferred scenarios are in the order of 1, 2, 3.
Should scenario 1 happen, it will provide a great opportunity to long on pull back at a better price (maybe around 0.54-0.56) after a reversal candlestick pattern shows up.
For scenario 2, aggressive traders can jump in first during the consolidating period. Else, you can wait for the confirmation of a successful break up.
For scenario 3, breakout traders can jump in after the price breaks and close above 0.64.
Else, we can wait for a break and retest pattern (also shown in the daily chart) to long at around 0.64. The downside of this is that the retest of the neckline might not happen.
I am bullish as long as it stays above 0.5.
Will the affordable housing theme play out for PESONA? Feel free to comment below in terms of fundamental, news, discounted cash flow or any other forms of analysis :)
Topics That You Do Not Want To Miss
How to determine the "bullishness" of the patterns- https://www.facebook.com/BursaSGXcandlestick/videos/378260995905662/
The Trade Management Technique You Need To Know - http://klse.i3investor.com/blogs/candlestick/114496.jsp
Best Way To Learn To Trade Without A Mentor - http://klse.i3investor.com/blogs/candlestick/113821.jsp
Entry Illustration - http://klse.i3investor.com/blogs/candlestick/113605.jsp
Stop Loss & Safe Trading - http://klse.i3investor.com/blogs/candlestick/113510.jsp
Position Sizing - http://klse.i3investor.com/blogs/candlestick/113061.jsp
Come Up With Trading Ideas & Turn Them Into Investing Ideas - http://klse.i3investor.com/blogs/candlestick/114110.jsp
Cheers,
Ming Jong
Get Update From ==> http://www.vipplatform.com/lp/ideas/
& FB page ==> https://www.facebook.com/BursaSGXcandlestick/
Telegram Channel ==> https://t.me/BursaSGXCandlestick
Contact Via Email ==> ![]()
Related Stocks
| Chart | Stock Name | Last | Change | Volume |
|---|
More articles on Candlestick & Breakout Patterns
IQGROUP Rounding Bottom Breakout With A Beautiful Uptrending Channel
Created by Ming Jong Tey | Jun 29, 2017
RCECAP Rounding Bottom Breakout Plus Trending Up Inside A Channel
Created by Ming Jong Tey | May 25, 2017
PENTA Revisit - Rounding Bottom Breakout In A Long-Term Time Frame
Created by Ming Jong Tey | May 21, 2017
Featured Posts
Introducing MY's First IPO Fund for Sophisticated Investors!
New Update. Discover investment communities that resonate with your ideas
M & A Value Partners IPO Equity Fund has been launched - Targeted 13% Return p.a
Latest Videos


Apps


Top Articles
2
save malaysia!
3
BFM Podcast
4
BFM Podcast
5
BFM Podcast
6
BFM Podcast
7
BFM Podcast
8
BFM Podcast
#
Stock
Score
Daily Stocks
Stock Name
Last
Change
Volume
Stock Name
Last
Change
Volume
Stock Name
Last
Change
Volume
Featured Advertisers / Partners


Ride The Bull Short The Bear
CS Tan
4.9 / 5.0
This book is the result of the author's many years of experience and observation throughout his 26 years in the stockbroking industry. It was written for general public to learn to invest based on facts and not on fantasies or hearsay....
VenFx
Good observation .
2016-12-26 17:37