


Candlestick & Breakout Patterns
HIBISCS - A Pumped & Dumped Or A Start Of Accumulation Phase?

Ming Jong Tey
Publish date: Fri, 30 Dec 2016, 12:23 PM
Ming Jong Tey
0 68
Understand the psychology behind the candlestick & breakout pattern will give you an edge to realize why the market does what it does and anticipate opportunities before they happen!
Get notified on The Next Best Trading & Investing Ideas for free:
Visit ==> http://www.vipplatform.com/lp/ideas/
"Like" FB Page ==> https://www.facebook.com/BursaSGXcandlestick/
"Join" Telegram Channel ==> https://t.me/BursaSGXCandlestick
Get notified on The Next Best Trading & Investing Ideas for free:
Visit ==> http://www.vipplatform.com/lp/ideas/
"Like" FB Page ==> https://www.facebook.com/BursaSGXcandlestick/
"Join" Telegram Channel ==> https://t.me/BursaSGXCandlestick
This analysis is my response to another reader. We all heard horrible stories on lots of oil and gas counters and HIBISCS (5199) is no stranger to us.
Is this another pumped and dumped or a start of accumulation phase? Let's draw some hints from the charts below:
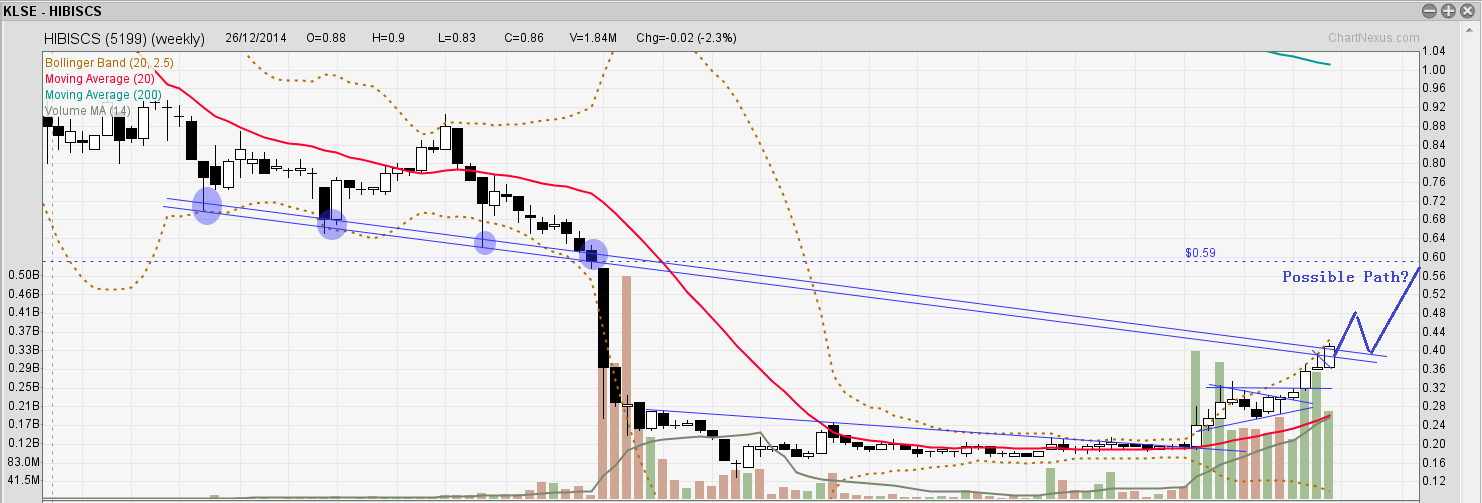
From the weekly chart above, HIBISCS is meeting a resistance trendline. If it can stay above 0.41 or at least consolidating around the resistance trendline, I am expecting a bullish possible pathway as shown above.
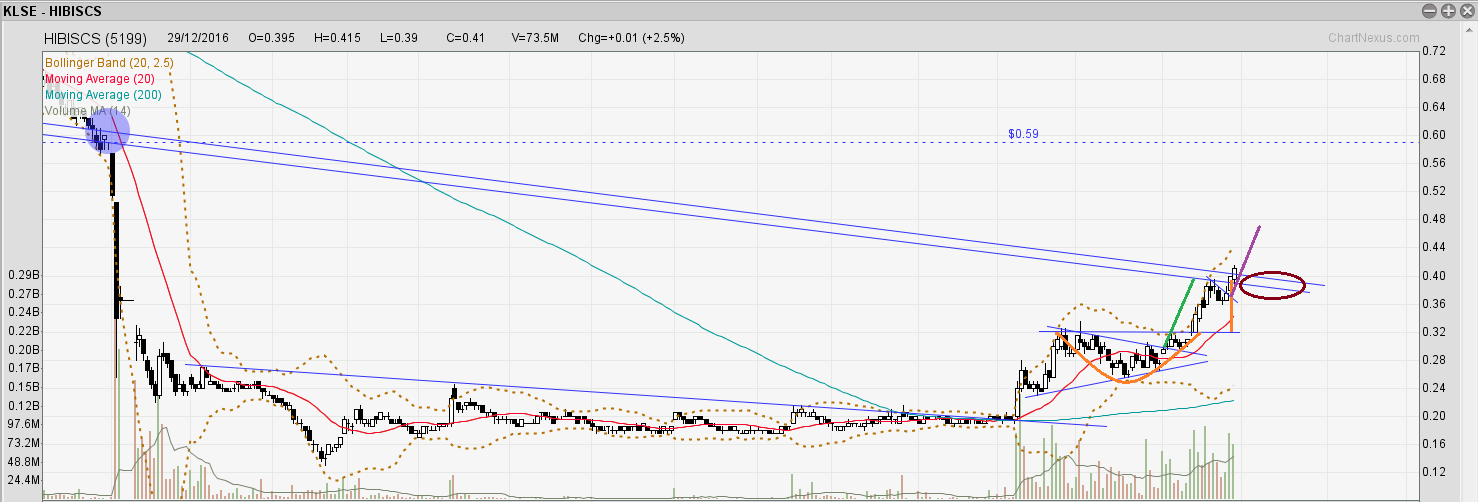
As shown in the daily chart above, we can spot a few patterns.
The first is a break up from a triangle, with a target price (green projection) hitting nicely on the trendline resistance.
The second is a small rounding bottom as illustrated in orange colour, with a target price (based on orange projection) coincides with the triangle break up projection.
Third, a flag breaks up with a target price of 0.47, as shown in the purple projection.
0.6 is the second target price.
HIBISCS (5199): Bullish
Pattern: Flag Breaks Up
I hold my bullish view on HIBISCS as long as it stays above 0.36. If it breaks the resistance trendline with strong momentum, any pull back to backtest the resistance-turned-support trendline (as circled in purple) could be a buy signal (watch out for candlestick reversal pattern).
Based on the structure, it reached its selling climax back in Nov 2015 and took a year to consolidate and bottom out. Volume started to pick up in Oct 2016, at the bottom phase, which is always a healthy sign for accumulation.
Do you spot any interesting pattern? Feel free to share them to bounce off some more trading / investing ideas.
Topics That You Do Not Want To Miss
How to determine the "bullishness" of the patterns- https://www.facebook.com/BursaSGXcandlestick/videos/378260995905662/
The Trade Management Technique You Need To Know - http://klse.i3investor.com/blogs/candlestick/114496.jsp
Best Way To Learn To Trade Without A Mentor - http://klse.i3investor.com/blogs/candlestick/113821.jsp
Entry Illustration - http://klse.i3investor.com/blogs/candlestick/113605.jsp
Stop Loss & Safe Trading - http://klse.i3investor.com/blogs/candlestick/113510.jsp
Position Sizing - http://klse.i3investor.com/blogs/candlestick/113061.jsp
Come Up With Trading Ideas & Turn Them Into Investing Ideas - http://klse.i3investor.com/blogs/candlestick/114110.jsp
Cheers,
Ming Jong
Get Update From ==> http://www.vipplatform.com/lp/ideas/
& FB page ==> https://www.facebook.com/BursaSGXcandlestick/
Telegram Channel ==> https://t.me/BursaSGXCandlestick
Contact Via Email ==> ![]()
More articles on Candlestick & Breakout Patterns
IQGROUP Rounding Bottom Breakout With A Beautiful Uptrending Channel
Created by Ming Jong Tey | Jun 29, 2017
RCECAP Rounding Bottom Breakout Plus Trending Up Inside A Channel
Created by Ming Jong Tey | May 25, 2017
PENTA Revisit - Rounding Bottom Breakout In A Long-Term Time Frame
Created by Ming Jong Tey | May 21, 2017
Featured Posts


Latest Videos


Apps


Top Articles
2
save malaysia!
3
BFM Podcast
4
BFM Podcast
5
BFM Podcast
6
BFM Podcast
7
BFM Podcast
8
BFM Podcast
#
Stock
Score
Daily Stocks
Stock Name
Last
Change
Volume
Stock Name
Last
Change
Volume
Stock Name
Last
Change
Volume
MQ Trading Signals
Stock
Time
Signal
Duration
No trading signals available.
Stock
Time
Signal
Duration
No trading signals available.
Featured Advertisers / Partners


Ride The Bull Short The Bear
CS Tan
4.9 / 5.0
This book is the result of the author's many years of experience and observation throughout his 26 years in the stockbroking industry. It was written for general public to learn to invest based on facts and not on fantasies or hearsay....
speakup
Parreira now GORENG KING
2016-12-30 14:26