


Candlestick & Breakout Patterns
After 4 Months Brewing On My Favorite Pattern, AWC Finally Broke Out

Ming Jong Tey
Publish date: Tue, 03 Jan 2017, 04:17 PM
Ming Jong Tey
0 68
Understand the psychology behind the candlestick & breakout pattern will give you an edge to realize why the market does what it does and anticipate opportunities before they happen!
Get notified on The Next Best Trading & Investing Ideas for free:
Visit ==> http://www.vipplatform.com/lp/ideas/
"Like" FB Page ==> https://www.facebook.com/BursaSGXcandlestick/
"Join" Telegram Channel ==> https://t.me/BursaSGXCandlestick
Get notified on The Next Best Trading & Investing Ideas for free:
Visit ==> http://www.vipplatform.com/lp/ideas/
"Like" FB Page ==> https://www.facebook.com/BursaSGXcandlestick/
"Join" Telegram Channel ==> https://t.me/BursaSGXCandlestick
AWC (7579): Bullish
Pattern: Cup & Handle Breaks Up
As usual, let's look at AWC's weekly chart first:
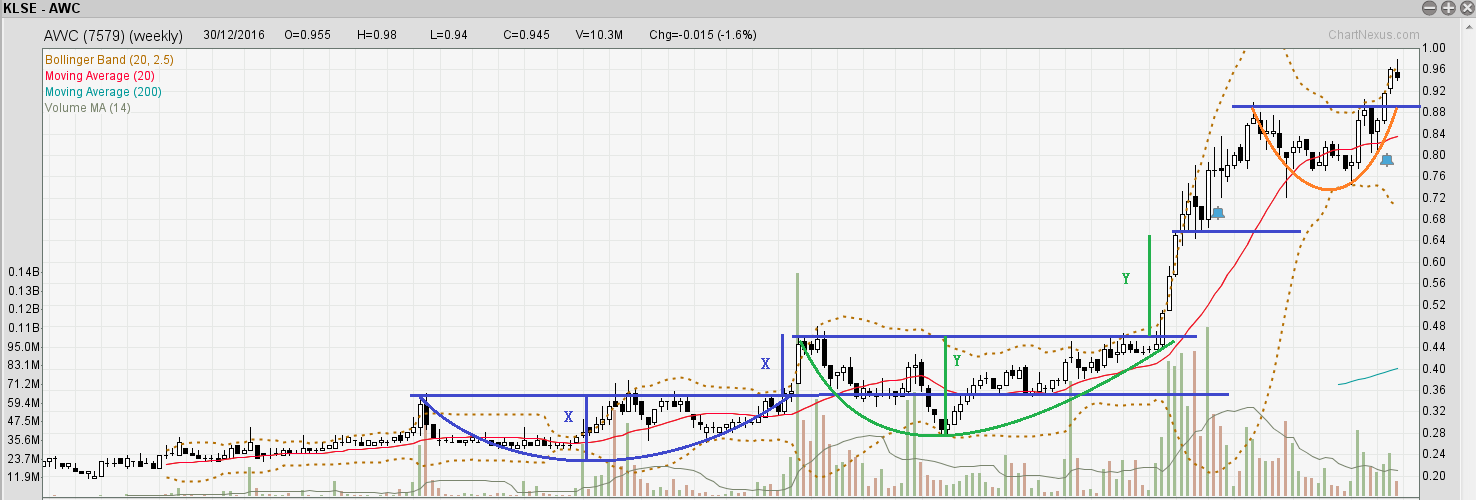
There are 3 rounding bottom patterns as shown in the weekly chart. The target price for the first and second as illustrated in blue and green has been achieved, based on the projection of X & Y as shown.
Let's zoom in the daily chart for the recent breakout, as shown below:
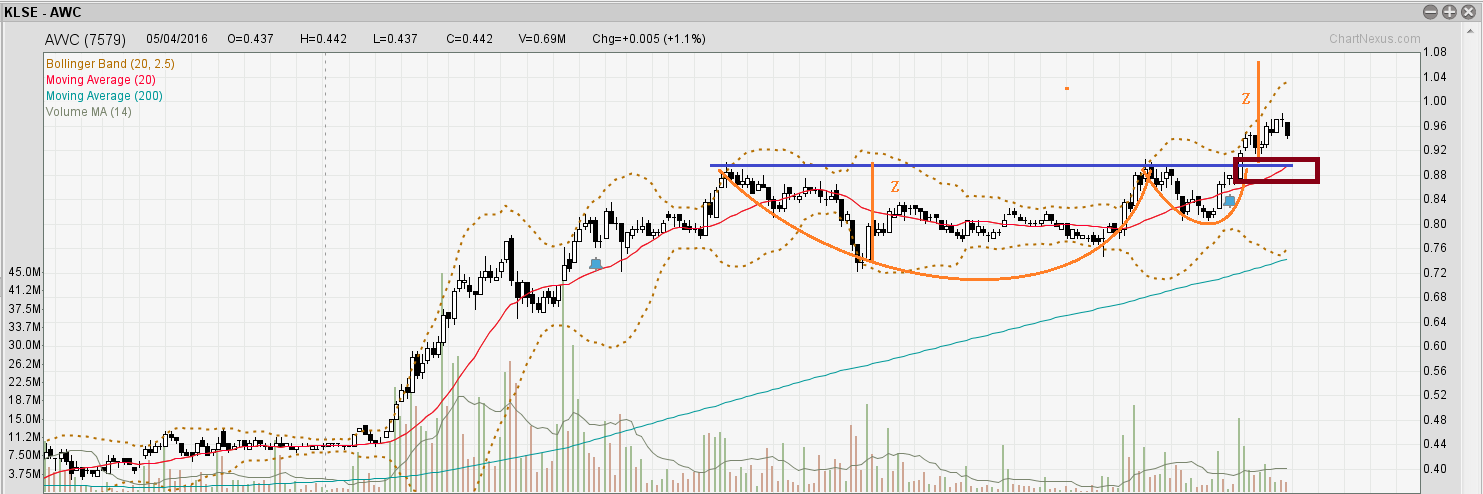
A cup & handle pattern was formed from August till December 2016 (illustrated in orange) and the price broke up recently, with a target price of 1.06 based on the projection of Z.
I am bullish on AWC on the break up of the cup and handle pattern as long as it stays above the brown box region.
Rounding Bottom/Cup & Handle
If you pay attention to my past posts, you will notice that a lot of the bullish stocks contain rounding bottom (or cup and handle) patterns.
Below are a few of my past posts containing the pattern if you haven't seen:
- JHM Rounding Bottom + Flag Break Up
- PRESTAR Super Area of Confluence From Two Cups & Handles On Daily & Weekly
- PESONA Rounding Bottom Hitting Neckline With Strong Resistance - 3 Possible Scenarios Inside
- JOHOTIN - Third Attempt To Break Historical High With This Reliable Pattern?
- MIECO - Rounding Bottom With A Red Flag
- The Era of USD/MYR = 5.0 In The Coming 2017?
- Comparison Among HEVEA, POHUAT, LIIHEN, LATITUD, FFHB, HOMERIZ - Which One Is The Most Bullish?
Whenever there is rounding forming, there is strength in it. Therefore, this pattern is a reliable pattern and is popular.
Some of you might be asking, what about rounding top?
Does it mean it is bearish?
Yup! A rounding top pattern is bearish. So, next time if you spot rounding bottom/top, pay extra attention.
Next time I will elaborate in detail on several ways to trade on the pattern depending on your personality and risk appetite.
Topics That You Do Not Want To Miss
How to determine the "bullishness" of the patterns- https://www.facebook.com/BursaSGXcandlestick/videos/378260995905662/
The Trade Management Technique You Need To Know - http://klse.i3investor.com/blogs/candlestick/114496.jsp
Best Way To Learn To Trade Without A Mentor - http://klse.i3investor.com/blogs/candlestick/113821.jsp
Entry Illustration - http://klse.i3investor.com/blogs/candlestick/113605.jsp
Stop Loss & Safe Trading - http://klse.i3investor.com/blogs/candlestick/113510.jsp
Position Sizing - http://klse.i3investor.com/blogs/candlestick/113061.jsp
Come Up With Trading Ideas & Turn Them Into Investing Ideas - http://klse.i3investor.com/blogs/candlestick/114110.jsp
Cheers,
Ming Jong
Get Update From ==> http://www.vipplatform.com/lp/ideas/
& FB page ==> https://www.facebook.com/BursaSGXcandlestick/
Telegram Channel ==> https://t.me/BursaSGXCandlestick
Contact Via Email ==> ![]()
More articles on Candlestick & Breakout Patterns
IQGROUP Rounding Bottom Breakout With A Beautiful Uptrending Channel
Created by Ming Jong Tey | Jun 29, 2017
RCECAP Rounding Bottom Breakout Plus Trending Up Inside A Channel
Created by Ming Jong Tey | May 25, 2017
PENTA Revisit - Rounding Bottom Breakout In A Long-Term Time Frame
Created by Ming Jong Tey | May 21, 2017
Discussions
3 people like this. Showing 2 of 2 comments
Refer https://www.facebook.com/BursaSGXcandlestick/posts/313117465753349:0 for the chart analysis.
2017-02-22 21:59
Post a Comment
Featured Posts
Introducing MY's First IPO Fund for Sophisticated Investors!
New Update. Discover investment communities that resonate with your ideas
M & A Value Partners IPO Equity Fund has been launched - Targeted 13% Return p.a
Latest Videos


Apps


Top Articles
2
save malaysia!
3
BFM Podcast
4
BFM Podcast
5
BFM Podcast
6
BFM Podcast
7
BFM Podcast
8
BFM Podcast
#
Stock
Score
Daily Stocks
Stock Name
Last
Change
Volume
Stock Name
Last
Change
Volume
Stock Name
Last
Change
Volume
MQ Trading Signals
Stock
Time
Signal
Duration
No trading signals available.
Stock
Time
Signal
Duration
No trading signals available.
Featured Advertisers / Partners


Ride The Bull Short The Bear
CS Tan
4.9 / 5.0
This book is the result of the author's many years of experience and observation throughout his 26 years in the stockbroking industry. It was written for general public to learn to invest based on facts and not on fantasies or hearsay....
Ming Jong Tey
First TP was hit. AWC hitting the resistance-turned-support zone, i.e. the flip zone. A possible entry to long as circled in blue with annotation "support".
2017-02-22 21:58