


Candlestick & Breakout Patterns
Super Hot Stock NOTION - How To Trade & A Stop Loss Question

Ming Jong Tey
Publish date: Wed, 11 Jan 2017, 09:37 PM
Ming Jong Tey
0 68
Understand the psychology behind the candlestick & breakout pattern will give you an edge to realize why the market does what it does and anticipate opportunities before they happen!
Get notified on The Next Best Trading & Investing Ideas for free:
Visit ==> http://www.vipplatform.com/lp/ideas/
"Like" FB Page ==> https://www.facebook.com/BursaSGXcandlestick/
"Join" Telegram Channel ==> https://t.me/BursaSGXCandlestick
Get notified on The Next Best Trading & Investing Ideas for free:
Visit ==> http://www.vipplatform.com/lp/ideas/
"Like" FB Page ==> https://www.facebook.com/BursaSGXcandlestick/
"Join" Telegram Channel ==> https://t.me/BursaSGXCandlestick
I have got a question regarding trading on NOTION, a super hot stock that shot up from 0.455 to 0.69, a whopping 50% within 7 trading days.
How would one trade it? Where should we place a proper stop loss?
Let's take a look a the weekly chart below:
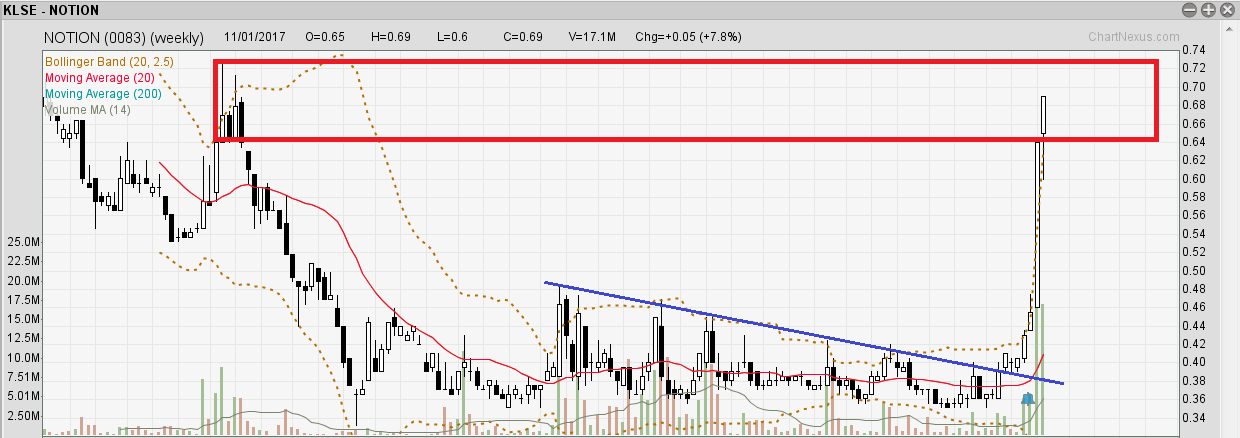
We can see that price broke out from the downtrend line about 7 weeks ago. However, It is hitting the previous supply zone and it is overbought.
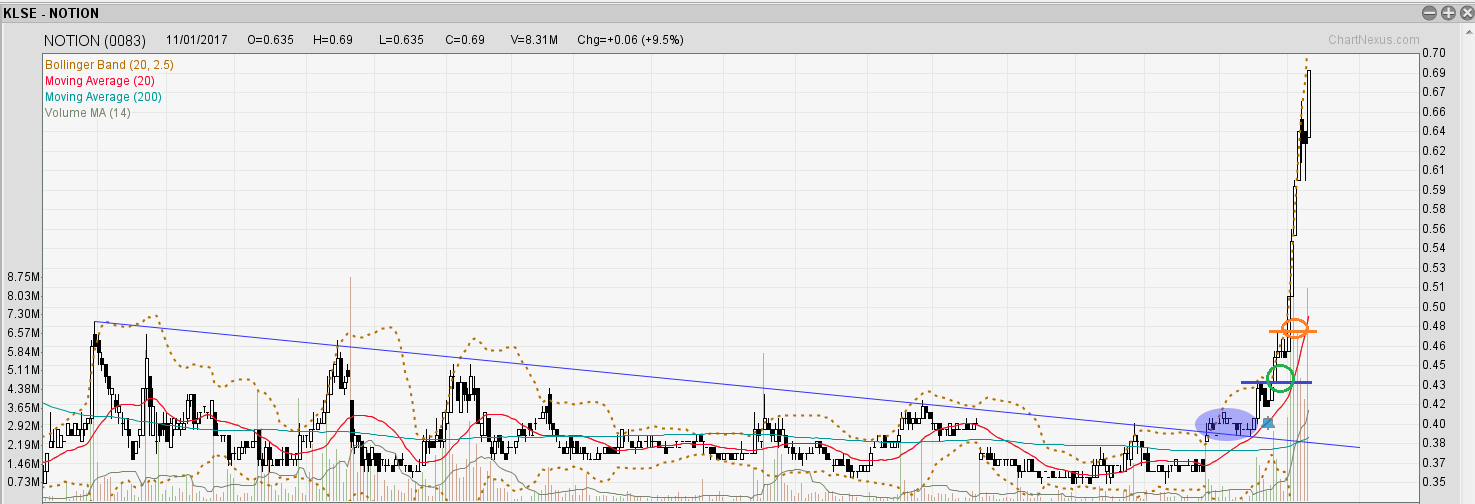
From NOTION's daily chart above, I have highlighted a few possible entries. The first one is the blue circled area where it broke out of the downtrend line. A stop can be placed below the bottom, i.e. Around 0.34.
A second entry could be trading the breakout at the green circled with a stop below the previous swing low, which is around 0.4.
A third entry could be trading the breakout at the orange circle with a stop below the consolidation area, which is around 0.44.
One thing to note from this stock: Opportunities are available for breakout trading only. If you are waiting to trade on pull back and retest the previous resistance-tuned support, there weren't any chance.
Check out http://klse.i3investor.com/blogs/candlestick/113510.jsp for more information on stop loss and safe trading.
What if one miss out all 3 entries and only see it today or last Friday?
Last Friday closing price for NOTION is 0.64 and it has been going up from 0.455 within 4 days, without any retracement or consolidation. I won't recommend chasing the stock because the price is over-stretched and there is not a "good spot" to place a stop. A stop below orange circle area at around 0.44 is too far away and it just does not make sense. The price between 0.44 - 0.64 does not have any support so it will not make sense to place between this range.
Can you buy today since there are 2 black candles on Monday and Tuesday, which some might consider as consolidation? Buy at open price 0.635 and put a stop below the consolidation area, i.e. 0.58?
The answer is a reluctantly YES if you are willing to take the risk since it has been over-bought.
I will avoid chasing because:
1. The 2 black candles on Monday & Tuesday do not look like a consolidation rather a bearish signal pending a confirmation.
2. This kind of sharp rise without any pullback is very hard to anticipate how deep a pullback will be when it comes.
3. Price is running into the previous supply zone and it is not wise to buy at this area.
4. There are plenty of choices to trade. Why insist on this?
Topics That You Do Not Want To Miss
How to determine the "bullishness" of the patterns- https://www.facebook.com/BursaSGXcandlestick/videos/378260995905662/
The Trade Management Technique You Need To Know - http://klse.i3investor.com/blogs/candlestick/114496.jsp
Best Way To Learn To Trade Without A Mentor - http://klse.i3investor.com/blogs/candlestick/113821.jsp
Position Sizing - http://klse.i3investor.com/blogs/candlestick/113061.jsp
Come Up With Trading Ideas & Turn Them Into Investing Ideas - http://klse.i3investor.com/blogs/candlestick/114110.jsp
Cheers,
Ming Jong
Get Update From ==> http://www.vipplatform.com/lp/ideas/
& FB page ==> https://www.facebook.com/BursaSGXcandlestick/
Telegram Channel ==> https://t.me/BursaSGXCandlestick
Contact Via Email ==> ![]()
More articles on Candlestick & Breakout Patterns
IQGROUP Rounding Bottom Breakout With A Beautiful Uptrending Channel
Created by Ming Jong Tey | Jun 29, 2017
RCECAP Rounding Bottom Breakout Plus Trending Up Inside A Channel
Created by Ming Jong Tey | May 25, 2017
PENTA Revisit - Rounding Bottom Breakout In A Long-Term Time Frame
Created by Ming Jong Tey | May 21, 2017
Featured Posts
Introducing MY's First IPO Fund for Sophisticated Investors!
New Update. Discover investment communities that resonate with your ideas
M & A Value Partners IPO Equity Fund has been launched - Targeted 13% Return p.a
Latest Videos


Apps


Top Articles
2
save malaysia!
3
BFM Podcast
4
BFM Podcast
5
BFM Podcast
6
BFM Podcast
7
BFM Podcast
8
BFM Podcast
#
Stock
Score
Daily Stocks
Stock Name
Last
Change
Volume
Stock Name
Last
Change
Volume
Stock Name
Last
Change
Volume
MQ Trading Signals
Stock
Time
Signal
Duration
No trading signals available.
Stock
Time
Signal
Duration
No trading signals available.
Featured Advertisers / Partners


Ride The Bull Short The Bear
CS Tan
4.9 / 5.0
This book is the result of the author's many years of experience and observation throughout his 26 years in the stockbroking industry. It was written for general public to learn to invest based on facts and not on fantasies or hearsay....