


Candlestick & Breakout Patterns
SKPETRO - A Bottom Out Structure Breakout Plus A Peep Into The Crude Oil Future

Ming Jong Tey
Publish date: Tue, 07 Feb 2017, 03:58 PM
Ming Jong Tey
0 68
Understand the psychology behind the candlestick & breakout pattern will give you an edge to realize why the market does what it does and anticipate opportunities before they happen!
Get notified on The Next Best Trading & Investing Ideas for free:
Visit ==> http://www.vipplatform.com/lp/ideas/
"Like" FB Page ==> https://www.facebook.com/BursaSGXcandlestick/
"Join" Telegram Channel ==> https://t.me/BursaSGXCandlestick
Get notified on The Next Best Trading & Investing Ideas for free:
Visit ==> http://www.vipplatform.com/lp/ideas/
"Like" FB Page ==> https://www.facebook.com/BursaSGXcandlestick/
"Join" Telegram Channel ==> https://t.me/BursaSGXCandlestick
SKPETRO (5218): Bullish
Pattern: Double Bottom Breakout
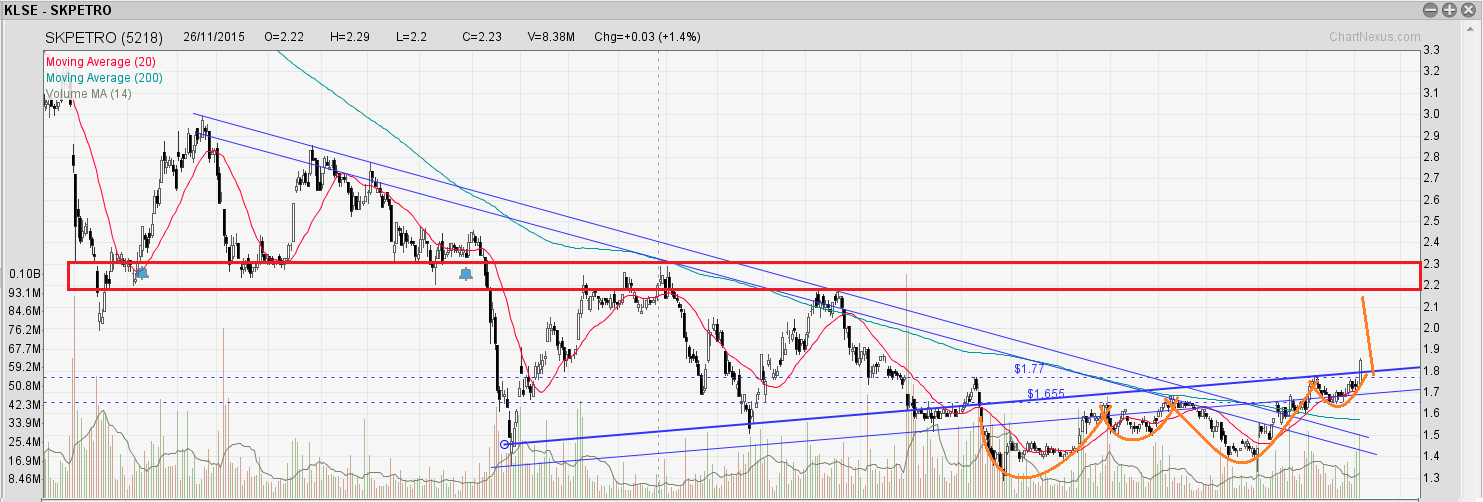
From the daily chart above, SKPETRO broke out from the downtrend line a few weeks before. Also, we can spot a double bottom with a breakout happened on yesterday.
The projected target price will be around 2.1X, which is closed to the overhead resistance as shown in the red rectangle (2.2-2.3). A buy on pullback or breakout of a pattern are both valid entries.
Crude Oil Future
Perhaps a lot of you will be interested in the crude oil price because after all, the movement of the oil and gas counters are closely correlated with the crude oil price.
Let's take a look at the light crude oil future weekly chart below:
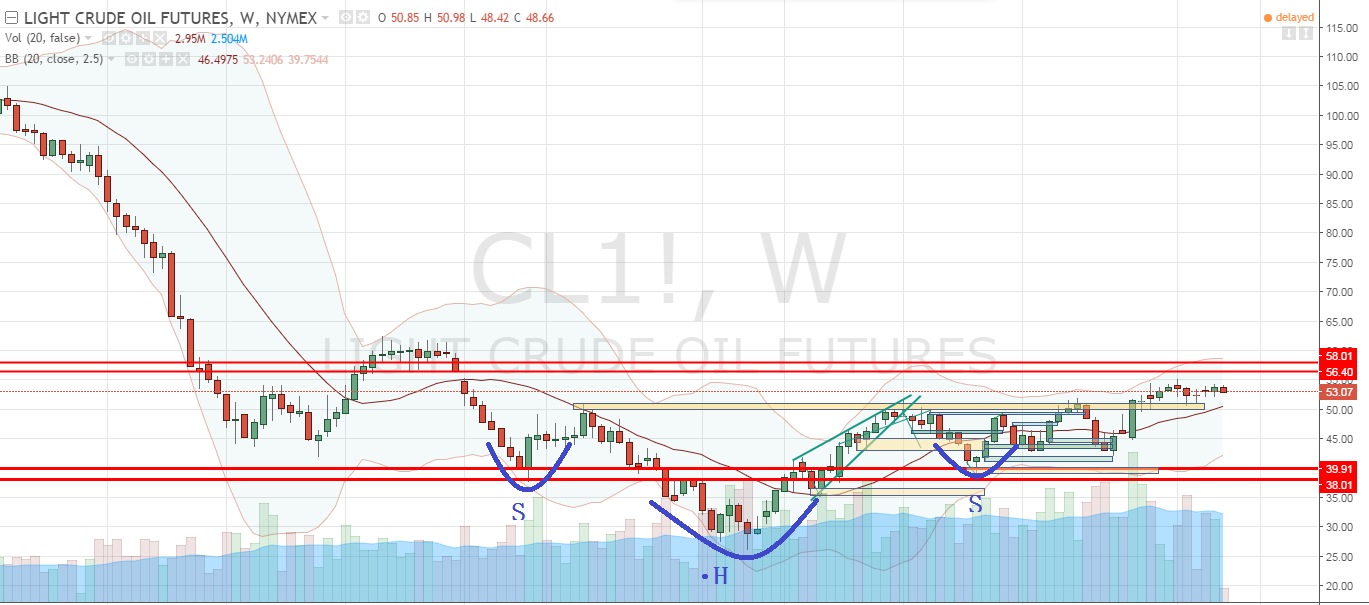
There is a clear inverse head and shoulder pattern as marked in blue above. The light crude oil price has broken the neckline, which is around 50 and now is consolidating above it. The target price for the crude oil is around 75 based on the pattern.
Should the crude oil maintain its bullish uptrend, it will not be surprised to see strong uptrend for oil and gas counters like SKPETRO, HIBISCS, etc...
Having said that, please trade with care and have proper risk management with position sizing.
Leave me a comment below and let me know what you think. If you have any queries or want to share the next big stock with me, feel free to contact me via my email or FB page below.
Topics That You Do Not Want To Miss
How to determine the "bullishness" of the patterns- https://www.facebook.com/BursaSGXcandlestick/videos/378260995905662/
The Trade Management Technique You Need To Know - http://klse.i3investor.com/blogs/candlestick/114496.jsp
Best Way To Learn To Trade Without A Mentor - http://klse.i3investor.com/blogs/candlestick/113821.jsp
Entry Setup Illustration - http://klse.i3investor.com/blogs/candlestick/113605.jsp
Stop Loss & Safe Trading - http://klse.i3investor.com/blogs/candlestick/113510.jsp
Come Up With Trading Ideas & Turn Them Into Investing Ideas - http://klse.i3investor.com/blogs/candlestick/114110.jsp
Cheers,
Ming Jong
Get Update From ==> http://www.vipplatform.com/lp/ideas/
& FB page ==> https://www.facebook.com/BursaSGXcandlestick/
Telegram Channel ==> https://t.me/BursaSGXCandlestick
Contact Via Email ==> ![]()
More articles on Candlestick & Breakout Patterns
IQGROUP Rounding Bottom Breakout With A Beautiful Uptrending Channel
Created by Ming Jong Tey | Jun 29, 2017
RCECAP Rounding Bottom Breakout Plus Trending Up Inside A Channel
Created by Ming Jong Tey | May 25, 2017
PENTA Revisit - Rounding Bottom Breakout In A Long-Term Time Frame
Created by Ming Jong Tey | May 21, 2017
Featured Posts


Latest Videos


Apps


Top Articles
2
save malaysia!
3
BFM Podcast
4
BFM Podcast
5
BFM Podcast
6
BFM Podcast
7
BFM Podcast
8
MQ Market Updates
#
Stock
Score
Daily Stocks
Stock Name
Last
Change
Volume
Stock Name
Last
Change
Volume
Stock Name
Last
Change
Volume
MQ Trading Signals
Stock
Time
Signal
Duration
No trading signals available.
Stock
Time
Signal
Duration
No trading signals available.
Featured Advertisers / Partners


Ride The Bull Short The Bear
CS Tan
4.9 / 5.0
This book is the result of the author's many years of experience and observation throughout his 26 years in the stockbroking industry. It was written for general public to learn to invest based on facts and not on fantasies or hearsay....
red_85
dream la...oil price wont go back to 75 above in next 5-10 years..oversupply still there..
2017-02-08 01:15