COMEX Gold Update
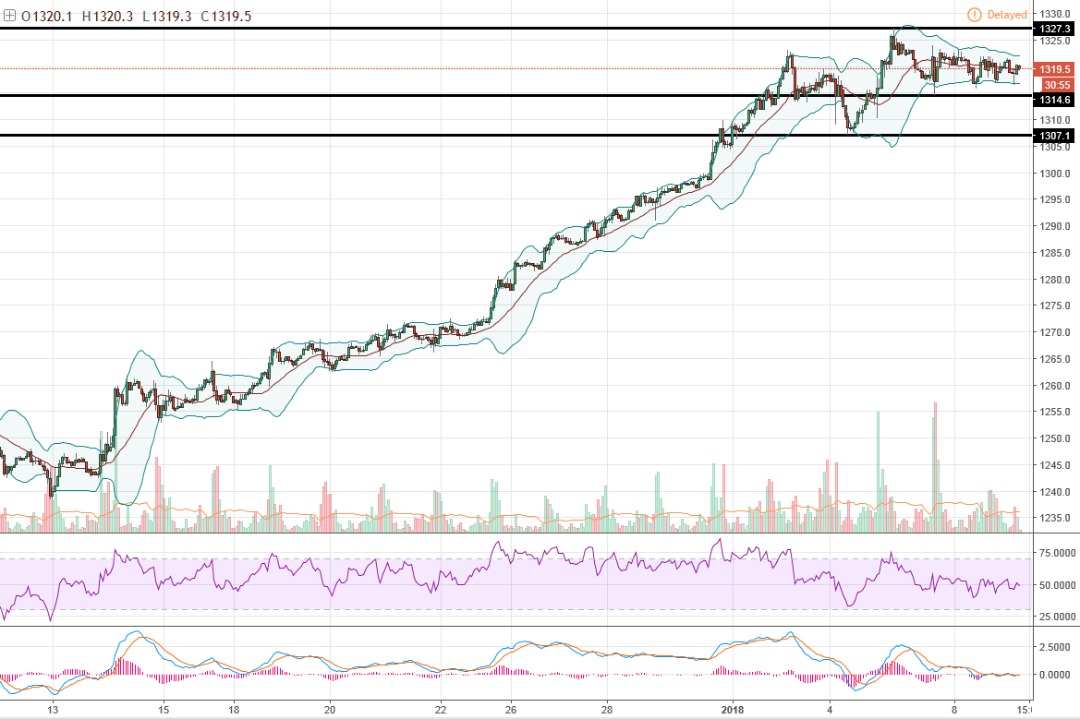
[Gold Futures] - Triangle Formation awaiting Breakout
InvestorsDoctor
Publish date: Tue, 09 Jan 2018, 03:18 PM
9/1/2018
Gold Feb 18
Previous close: 1320.4 -1.9

Gold edged down on yesterday, retreating further from last week's high as USD rebounded against Euro and as traders bet on further increases to US interest rates after last week's payrolls data.
Daily chart show gold enters RSI overbought correction but remain in rebound stage. Hourly chart formed a triangle pattern waiting for a breakout. Hourly chart's RSI & MACD crossing down, signaled that gold may test for further correction.
Price level to watch out today:
Resistance 1321.8 1327.3
Support 1314.6 1307.1
Recommended Trading Plan Today:
1. Buy 1320.4, stop 1318.9, profit 1.5 or above.
2. Sell 1318.9, stop 1320.4, profit 1.5 or above
Margin Requirement (per lot)
USD 4400
Micro: USD 440
Disclaimer: Idea for sharing purpose, trade at your own risk.
To get more information on local and foreign futures markets, join us on telegram & Facebook.
Join link: https://t.me/investorsdoctoracademy
Facebook: https://m.facebook.com/investorsdoctoracademy/
To get more information on local and foreign futures markets, join us on telegram & Facebook.
Join link: https://t.me/investorsdoctoracademy
Facebook: https://m.facebook.com/investorsdoctoracademy/
More articles on COMEX Gold Update
Daily Futures Commentaries: [Comex Gold] 23/12/2019 - Move in range, wait for more breakout
Created by InvestorsDoctor | Dec 23, 2019
Daily Futures Commentaries: [Comex Gold] 20/12/2019 - Move in range, wait for more breakout
Created by InvestorsDoctor | Dec 20, 2019
Daily Futures Commentaries: [Comex Gold] 19/12/2019 - Move in range, wait for more breakout
Created by InvestorsDoctor | Dec 19, 2019
Daily Futures Commentaries: [Comex Gold] 18/12/2019 - Move in range, wait for more breakout
Created by InvestorsDoctor | Dec 18, 2019
Daily Futures Commentaries: [Comex Gold] 17/12/2019 - Move in range, wait for more breakout
Created by InvestorsDoctor | Dec 17, 2019
Discussions
Be the first to like this. Showing 0 of 0 comments


