


HLBank Research Highlights
Gagasan Nadi Cergas - Sustainable Earnings Growth Supported by Cheap Valuations and Decent Dividend Yield

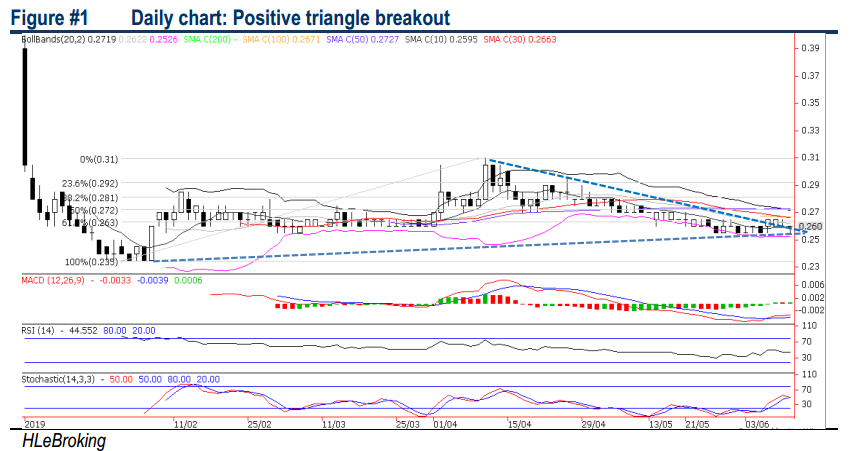
Following a 16% correction from YTD high of RM0.31 to RM0.26 yesterday, NADIBHD provides an attractive risk-reward profile at 5.8x FY19E P/E (14% lower against peers) and 0.46x P/B (66% discount against peers), underpinned by its unique integrated business model (i.e. construction, facility management, utilities and property development divisions) together with strong earnings visibility over RM700m construction order book and concessions fair values of more than RM600m. Technically, the stock is poised to retest RM0.27-0.31 upside targets following recent positive triangle breakout.
An established integrated design-and-build contractor equipped with proven expertise in facilities & utilities management. Incepted in 1999 (listed in Jan 2019 at RM0.30), Nadi Cergas Sdn Bhd (NADIBHD) holds a Grade G7 license approved by the Construction Industry Development Board (CIDB) Malaysia and Pusat Khidmat Kontraktor (PKK) which permits the Group to bid, secure and undertake construction projects for an unlimited amount including bumiputera-allocated projects.
Over RM3bn projects in the last 20 years. Leveraging on its team of qualified engineers and using latest technologies such as Industrialized Building System (IBS) and Building Information Modelling (BIM), in a span of more than two decades, NADIBHD had secured more than RM3bn worth of projects and built a vast array of iconic and sizable developments, including various academic institutions, public institutional buildings and public housing projects across Malaysia such as the German-Malaysian Institute, student hostels for Universiti Teknikal Malaysia Melaka and International Islamic University Malaysia,7 Polytechnics, 4th military camp for the General Operations Force of the Royal Malaysia Police etc.
Strong earnings visibility with over RM700m construction order book and concessions fair values of more than RM600m. NADIBHD has a proven track record in:
- Integrated construction of residential and non-residential buildings (including Design & Build). This division contributed about 61% to FY18 PBT. Current orderbook in excess of RM700m to sustain 2-3 year earnings visibility. Major projects secured are MRSM @ Bagan Datuk, Perak (RM96m), RumahSelangorku@ Bukit Raja, Selangor (RM97m), Rumah Selangorku @Putra Heights (RM241m), Cardiology Centre Serdang Hospital (RM290m), PR1MA Homes Pasir Mas, Kelantan (RM242m)
- Provision of facilities management (FM) and operation of utilities (contributed 47% to FY18 PBT), which would provide stable and long term recurring income stream to the group. According to Frost & Sullivan, growing positive reception for the FM business from both the public and private sectors is expected to drive the revenue to RM7.43bn in 2022 from RM4.79bn in 2017, recording a commendable CAGR of 9.17%.
- Facility management services/concessions: Key projects are the IIUM Student Hostel Concession Project in Kuantan, Pahang (20Y until 2034 with fair value contract of RM329m) and UTeMStudent Hostel Concession Project in Melaka (20Y until 2037 with fair value contract of RM292m).
- Utilities: Key projects are the 20-year District Cooling System (DCS) contract to provide chilled water for German-Malaysian Institute till 2028; 30-year DCS for Datum Jelatek Development upon completion in 2019; 30-year electricity distribution contract for Datum Jelatek Development upon completion.
- Property development (contributed ~3% to FY18 PBT). This division is a complementary to construction segment, a niche developer with land bank of 120.4 acres. Current projects include a JV with Asian Football Federation (AFF) to develop AFF headquarters (One 5-storey block) and serviced apartments (458 units) of Antara Residence (estimated GDV: RM179m); PPA1M Ulu Yam, Selangor worth GDV RM135m (447 units of single-storey and double-storey terrace houses); Serviced Apartments @ Lorong Haji Hussein, KL worth GDV RM150m.
Positive downtrend line breakout. NADIBHD has been holding up well above the support trend line since hitting YTD low of RM0.235 (29 Jan). A successful breakout above the downtrend line on 10 June is likely to spur prices towards RM0.27 (50% FR) and RM0.29 (23.6% FR) levels before reaching our LT objective of RM0.31 (10 Apr high). Meanwhile, key supports are situated at RM0.25 (lower Bollinger band) and RM0.245 (weekly lower Bollinger band). Cut loss at RM0.24.
Source: Hong Leong Investment Bank Research - 14 Jun 2019
Related Stocks
| Chart | Stock Name | Last | Change | Volume |
|---|
Market Buzz
More articles on HLBank Research Highlights
Technical tracker - HLIB Retail Research –19 July 2024 (Short-Selling)
Created by HLInvest | Jul 19, 2024
Discussions
Be the first to like this. Showing 0 of 0 comments
Post a Comment
Featured Posts
Introducing MY's First IPO Fund for Sophisticated Investors!
New Update. Discover investment communities that resonate with your ideas
M & A Value Partners IPO Equity Fund has been launched - Targeted 13% Return p.a
Latest Videos


MQ Trading Signals
Time
Signal
Duration
Type
2024-07-29 14:30:00
ADX
10 Mins
SELL
2024-07-29 14:30:00
ADX
5 Mins
SELL
2024-07-29 14:30:00
ADX
30 Mins
SELL
2024-07-29 14:30:00
VOLUME BREAKOUT
30 Mins
BUY
Apps


Top Articles
1
Good Articles to Share
Wall Street expert warns stock market is a 'really big accident waiting to happen'
2
4
南洋 - 凭单专栏/温世麟
5
TA Sector Research
6
TA Sector Research
7
Good Articles to Share
Democrats might put ‘someone else’ in Kamala Harris’ place, GOP sen warns #shorts
8
PublicInvest Research
#
Stock
Score
Daily Stocks
Stock Name
Last
Change
Volume
Stock Name
Last
Change
Volume
Stock Name
Last
Change
Volume
Featured Advertisers / Partners


Ride The Bull Short The Bear
CS Tan
4.9 / 5.0
This book is the result of the author's many years of experience and observation throughout his 26 years in the stockbroking industry. It was written for general public to learn to invest based on facts and not on fantasies or hearsay....