Kenanga Research & Investment
Daily Technical Highlights – (KAWAN,SCICOM)
kiasutrader
Publish date: Wed, 27 Nov 2019, 09:20 AM
KAWAN (Not Rated)

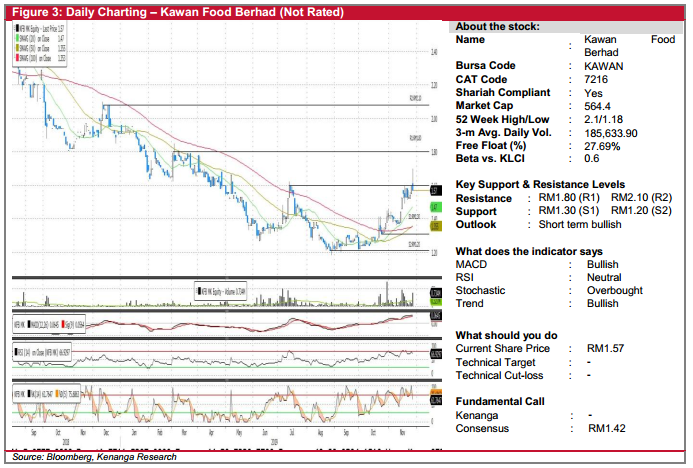
- KAWAN dropped 3.0sen (-1.88%) to close at RM1.57 yesterday.
- Chart-wise, the share has broken above the “rounding bottom” reversal chart pattern yesterday couple with higher-than average trading volume.
- Bullish crossover signal from MACD indicator further supports the trend reversal.
- Should the share continue heading north, key resistance levels are seen at RM1.80 (R1) and RM2.10 (R2).
- Conversely, key support levels can be seen at RM1.30 (S1) and RM1.20 (S2).
SCICOM (Not Rated)

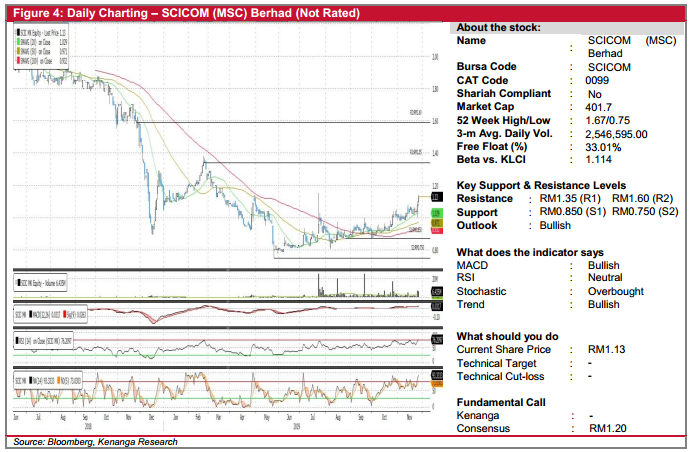
- SCICOM gained 5.0sen (+4.63%) to end at RM1.13 yesterday.
- Chart-wise, the share has been trading above all the key SMAs and yesterday, the share price has broken above the previous high coupled with higher-than-average trading volume.
- Besides, the bullish signal from MACD indicator further supports the underlying trend.
- From here on key resistance can be found at RM1.35 (R1) and RM1.60 (R2).
- Conversely, downside supports can be identified at RM0.850 (S1) and RM0.750 (S2).
Source: Kenanga Research - 27 Nov 2019
Related Stocks
| Chart | Stock Name | Last | Change | Volume |
|---|
More articles on Kenanga Research & Investment
Actionable Technical Highlights - PRESS METAL ALUMINIUM HLDG BHD (PMETAL)
Created by kiasutrader | Nov 25, 2024
Actionable Technical Highlights - PETRONAS CHEMICALS GROUP BHD (PCHEM)
Created by kiasutrader | Nov 25, 2024
Weekly Technical Highlights – Dow Jones Industrial Average (DJIA)
Created by kiasutrader | Nov 25, 2024
Malaysia Consumer Price Index - Edge up 1.9% in October amid food price surge
Created by kiasutrader | Nov 25, 2024
Discussions
Be the first to like this. Showing 0 of 0 comments


