Daily technical highlights – (OFI, PGF)
kiasutrader
Publish date: Fri, 09 Dec 2022, 09:07 AM

Oriental Food Industries Holdings Bhd (Technical Buy)
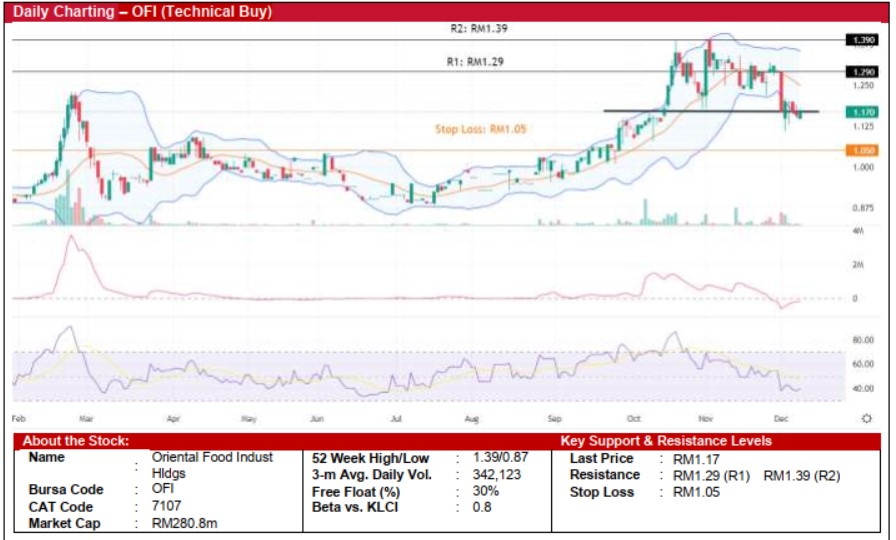
• OFI has staged a retracement of 20% from the previous high of RM1.39 in the beginning of November 2022 to as low as RM1.11 last Friday, which subsequently crossed back above the lower Bollinger band (after finding its intermediate supporting level) to close at RM1.17 yesterday.
• Backed by positive indicators of possible direction shift in RSI coupled with Chaikin Oscillator suggesting the easing of selling pressure, we anticipate that the stock could set to bounce off and steer away from the supporting level.
• Thus, we believe OFI’s share price could advance towards our resistance thresholds of RM1.29 (R1) and RM1.39 (R2), representing upside potentials of 10% and 19%, respectively.
• Our stop loss price is set at RM1.05 (or a downside risk of 10%).
• OFI is involved in the manufacture and sale of snack food, confectionery and biscuit products.
• The group recorded a net profit of RM7.1m (+61% QoQ) in 2QFY23, bringing its cumulative 1HFY23 net profit to RM11.6m (+115% YoY).

PGF Capital Bhd (Technical Buy)
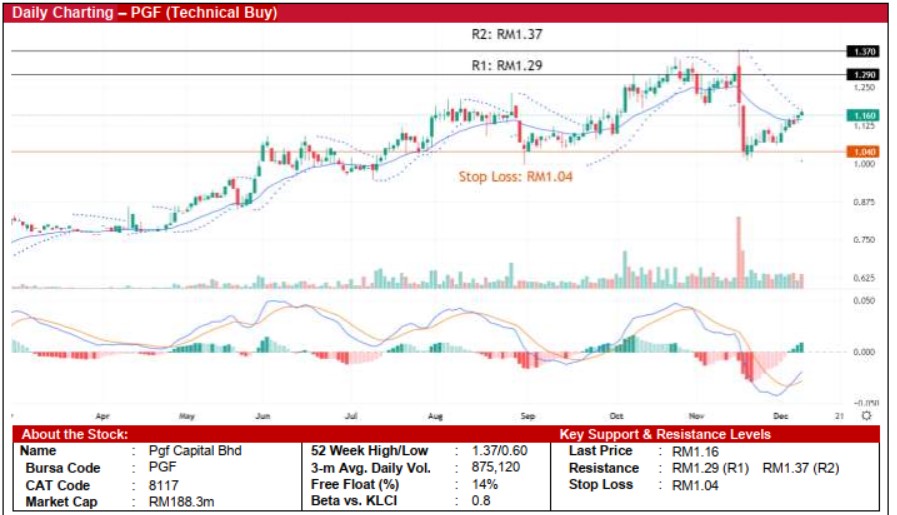
• Following a pullback from the peak of RM1.37 to a trough of RM1.01 in mid-November, PGF is still on an upward trajectory after bouncing off from its supporting level to close at RM1.16 yesterday.
• Following which, the share price will likely extend its reversal trend backed by: (i) emerging Parabolic SAR uptrend, and (ii) existence of a golden crossing in MACD indicator.
• Hence, the stock could rise to challenge our resistance levels of RM1.29 (R1; 11% upside potential) and RM1.37 (R2; 18% upside potential).
• We peg our stop loss at RM1.04, representing a downside risk of 10%.
• PGF is involved in the manufacture of fibre glass wool and property development.
• The group reported a 2QFY23 net profit of RM4.1m (vs. a RM1m loss in 2QFY22), bringing its 1HFY23 cumulative net profit to RM9.1m (+810% YoY).
Source: Kenanga Research - 9 Dec 2022
Related Stocks
| Chart | Stock Name | Last | Change | Volume |
|---|
More articles on Kenanga Research & Investment
Created by kiasutrader | Nov 22, 2024


