Daily technical highlights – (AEMULUS, ANNJOO)
kiasutrader
Publish date: Fri, 17 Feb 2023, 09:20 AM

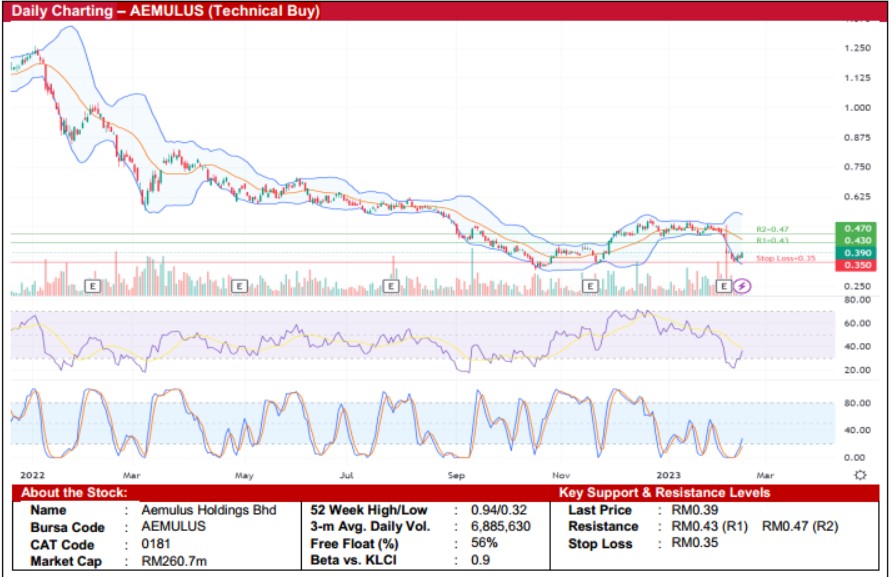
Aemulus Holdings Bhd (Technical Buy)
• The share price of AEMULUS has slid from a peak of RM1.26 in January 2022 to as low as RM0.315 in October 2022 beforeclosing at RM0.39 yesterday.
• On the chart, the share price is expected to continue its upward momentum backed by the following positive technical signals:(i) both the Stochastic and RSI indicators are in the midst of climbing out from the oversold area, and (ii) the stock price hascrossed back above the lower Bollinger Band.
• An ensuing run-up could then lift the stock to challenge our resistance levels of RM0.43 (R1; 10% upside potential) andRM0.47 (R2; 21% upside potential).
• Our stop loss level is pegged at RM0.35 (representing a 10% downside risk).
• Fundamentally speaking, AEMULUS is primarily involved in the design, engineering and development of automatic testequipment (ATE) products for semiconductor manufacturers and OSAT (outsourced semiconductor assembly and test)players, focusing on the testing and assembly of semiconductor wafer and packaged devices into various electronicappliances.
• Earnings-wise, the group turned to net loss of RM4.8m in 1QFY23 from a net profit of RM4.5m in 1QFY22 due to a slowdownin the semiconductor industry and the deferment of delivery orders.
• Based on consensus forecasts, AEMULUS’s net earnings are projected to pick up to RM6.4m in FY September 2023 andRM11.7m in FY September 2024, which translate to forward PERs of 40.7x this year and 22.3x next year, respectively.

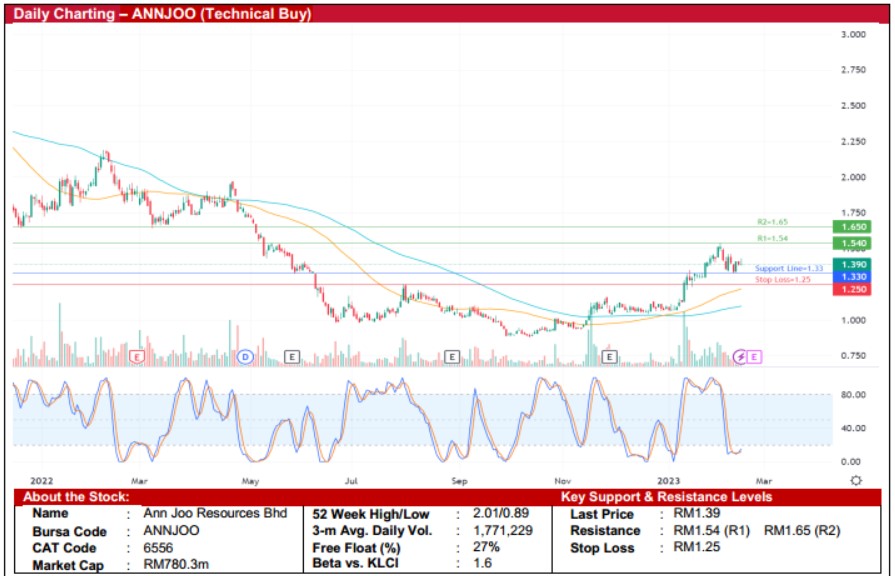
Ann Joo Resources Bhd (Technical Buy)
• ANNJOO’s share price has been trending downwards from its peak of RM3.18 since May 2021 to as low as RM0.885 inSeptember 2022. With the share price – which has since rebounded to close at RM1.39 yesterday – currently hovering nearits key support level of RM1.33, an extended upward trajectory is expected.
• From a technical perspective, a continuation of the rising momentum may be on the horizon as the Stochastic indicator isset to climb out from the oversold area while the 50-day moving average is hovering above the 100-day moving averagefollowing the golden cross in late December.
• Hence, we expect the stock to rise and test our resistance thresholds of RM1.54 (R1; 11% upside potential) and RM1.65(R2; 19% upside potential).
• Conversely, our stop loss price has been identified at RM1.25 (representing a 10% downside risk).
• Fundamentally speaking, ANNJOO is primarily involved in the manufacturing and trading of steel and steel-related products.
• Earnings-wise, the group turned to net loss of RM133.5m in 3QFY22 compared with a net profit of RM69.2m in 3QFY21 hitby higher cost of sales and the recognition of allowance for inventories write-down to net realisable value. This took 9MFY22bottomline to net loss of RM66.5m (versus net profit of RM41.9m previously).
• Based on consensus forecasts, ANNJOO’s net earnings are projected to recover to RM116.0m in FY December 2022 andRM73.5m in FY December 2023, which translate to forward PERs of 6.7x this year and 10.6x next year, respectively.
• Meanwhile, steel prices have bounced off from the bottom in late November 2022 amid an easing of the Covid lockdownpolicy in China. The re-opening of the China economy – together with steady demand from the construction and propertysectors – will likely support steel prices which in turn will benefit steel players like ANNJOO.
Source: Kenanga Research - 17 Feb 2023
Related Stocks
| Chart | Stock Name | Last | Change | Volume |
|---|
Market Buzz
2024-11-21
ANNJOO2024-11-20
AEMULUS2024-11-20
AEMULUS2024-11-20
AEMULUS2024-11-20
AEMULUS2024-11-20
AEMULUS2024-11-18
AEMULUS2024-11-14
AEMULUS2024-11-14
AEMULUS2024-11-14
AEMULUS2024-11-12
ANNJOO2024-11-12
ANNJOO2024-11-12
ANNJOO2024-11-12
ANNJOO2024-11-12
ANNJOO2024-11-12
ANNJOO2024-11-12
ANNJOO2024-11-12
ANNJOO2024-11-12
ANNJOO2024-11-12
ANNJOO2024-11-12
ANNJOO2024-11-12
ANNJOO2024-11-12
ANNJOO2024-11-12
ANNJOO2024-11-12
ANNJOO2024-11-12
ANNJOO2024-11-12
ANNJOO2024-11-12
ANNJOO2024-11-12
ANNJOO2024-11-12
ANNJOO2024-11-12
ANNJOOMore articles on Kenanga Research & Investment
Created by kiasutrader | Nov 22, 2024


