Kenanga Research & Investment
Actionable Technical Highlights – (MAXIS)
kiasutrader
Publish date: Wed, 04 Oct 2023, 10:00 AM

MAXIS BERHAD (Technical Buy)
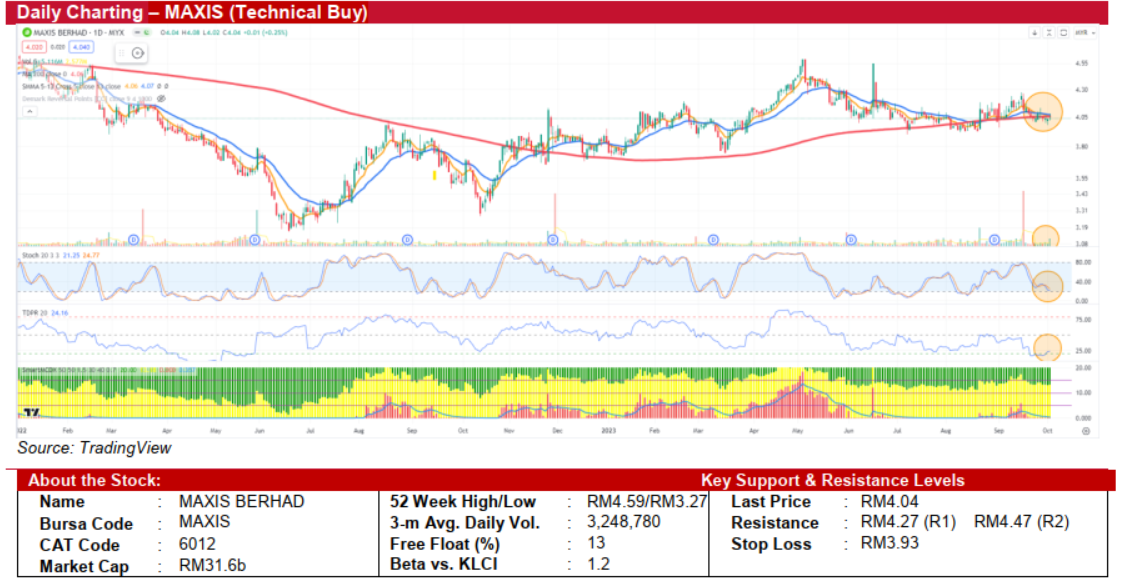
- Although MAXIS continues to trade within its consolidation range of RM3.98-RM4.13, the formation of a Doji candlestick pattern in the latest trading session, accompanied by increased volume, suggest potential directional change.
- Technically, the stochastic oscillator, set at 20,3,3 parameters, is nearing oversold conditions. This could signal a reversal of its prior downward trend. The stock's ability to hover near the 200-day SMA for the past eight days indicates a strong support level. Additionally, the Tom DeMark Pressure Ratio (TDRP) has shown early signs of an upward trend from its 20-level threshold, hinting at possible renewed buying interest.
- We anticipate MAXIS to oscillate around the 200-day SMA level of RM4.04. A decisive break above this key level could initiate a new uptrend, with immediate resistance levels at RM4.27 and RM4.47, the latter being the 200-week SMA.
- We advise entering the stock at RM4.04, which aligns with the 200-day SMA. Our initial target price is set at RM4.27, offering an estimated upside of approximately 5.7%. We also recommend a stop-loss at RM3.93, representing a downside risk of 2.7%.
Source: Kenanga Research - 4 Oct 2023
Related Stocks
| Chart | Stock Name | Last | Change | Volume |
|---|
More articles on Kenanga Research & Investment
Bond Weekly Outlook - MGS/GII likely to rise amid ongoing US economic resilience
Created by kiasutrader | Nov 22, 2024
Discussions
Be the first to like this. Showing 0 of 0 comments


