


Mercury Securities Research
SKB Shutters Corp (7115) - Testing New All-time High?

MercurySec
Publish date: Thu, 25 Jul 2024, 09:16 AM
MercurySec
0 98
An official blog in i3investor to publish research reports provided by Mercury Securities Research team.
All materials published here are prepared by Mercury Securities Sdn. Bhd.
Mercury Securities Sdn. Bhd.
L-7-2, No.2, Jalan Solaris,
Solaris Mont Kiara, 50480, Kuala Lumpur
Tel: 603-6203 7227
Email: mercurykl@mersec.com.my
All materials published here are prepared by Mercury Securities Sdn. Bhd.
Mercury Securities Sdn. Bhd.
L-7-2, No.2, Jalan Solaris,
Solaris Mont Kiara, 50480, Kuala Lumpur
Tel: 603-6203 7227
Email: mercurykl@mersec.com.my
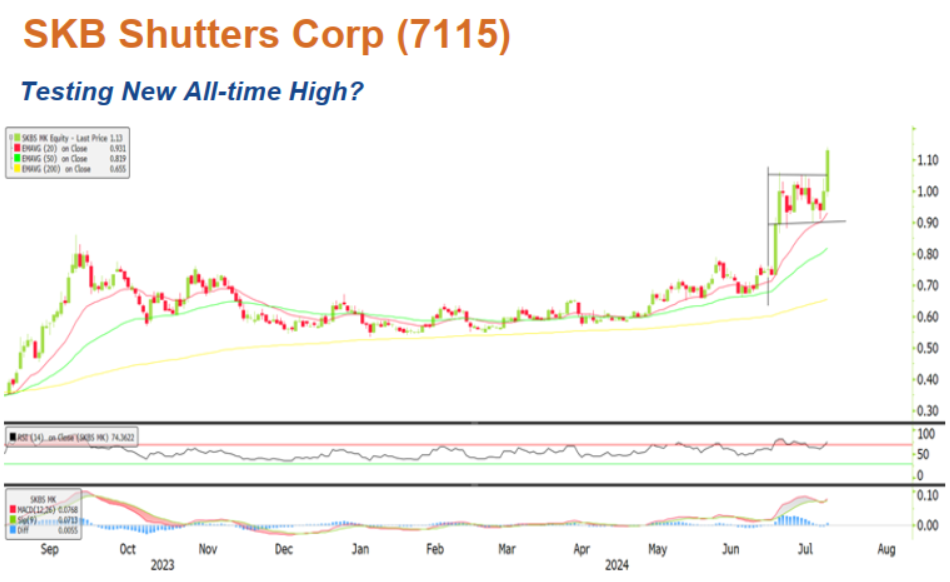
Technical Highlights
The recent upswing, coupled with the formation of a double large green candle, had led SKB’s share price to hover above all of its EMA lines for the past three weeks. Yesterday, the share price surged, forming a large green candle at the closing and breaking through the approximately three-week-long flag pattern with up-ticking momentum (RSI>70) and considerable trading volume (5.1 times more than its average 90-day trading volume). These positive indicators suggest that there may be more potential upside for the stock.
MACD shows momentum is strengthening with the MACD line crossing above the signal line recently. Similarly, short-term bullishness is further affirmed by the RSI hooking up.
With the flag pattern breaking out with positive momentum, we think the share could test the RM1.135 resistance (new all-time high) and subsequent RM1.220 resistance (derived based on the difference of RM0.085 of the high and low of the flag pattern). Conversely, consolidation starts if the share price dips below the RM0.520 support.
Entry – RM-1.130 – RM1.135
Stop Loss – RM0.515
Target Price – RM1.135 – RM1.220
Source: Mercury Securities Research - 25 Jul 2024
Related Stocks
| Chart | Stock Name | Last | Change | Volume |
|---|
More articles on Mercury Securities Research
Discussions
Be the first to like this. Showing 0 of 0 comments
Post a Comment
Featured Posts


Latest Videos


MQ Trading Signals
Time
Signal
Duration
Type
2024-07-25 16:30:00
ADX
30 Mins
SELL
2024-07-25 16:25:00
ADX
5 Mins
SELL
2024-07-25 16:00:00
TURTLE SYSTEM 20
30 Mins
SELL
2024-07-25 16:00:00
TURTLE SYSTEM 55
30 Mins
SELL
2024-07-25 16:00:00
ADX
10 Mins
SELL
Apps


Top Articles
1
BFM Podcast
2
3
4
CGS-CIMB Research
Genting Plantations - Proposed Land Acquisition in Indonesia
5
Koon Yew Yin's Blog
6
Good Articles to Share
#
Stock
Score
Daily Stocks
Stock Name
Last
Change
Volume
Stock Name
Last
Change
Volume
Stock Name
Last
Change
Volume
Featured Advertisers / Partners


Ride The Bull Short The Bear
CS Tan
4.9 / 5.0
This book is the result of the author's many years of experience and observation throughout his 26 years in the stockbroking industry. It was written for general public to learn to invest based on facts and not on fantasies or hearsay....