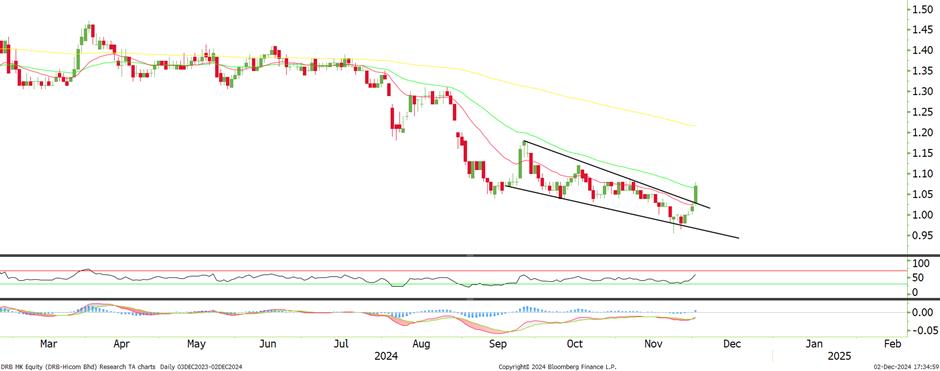
DRB-HICOM (1619) - Falling Wedge Breakout
MercurySec
Publish date: Tue, 03 Dec 2024, 10:04 AM

Technical Highlights
After reaching its 52-week high in early Apr, the stock entered into sideways movement before entering into consolidation mode. Since then, the stock showed no strong signals of recovery as trading interest remained muted. Yesterday, the spike in the buying interest (last trading volume was 1.8x higher than its average 90-days total trading volume) led the stock to close significantly higher and triggered a falling wedge pattern breakout. With the pattern breakout, the stock also started to trade above its EMA 20 line. These signals are supportive of the stock's trend reversal and the commencement of positive trend movement ahead.
Momentum indicators are supportive of the trend reversal. A strong pick-up in the RSI reinforces the trading interest, which is accumulating gradually. Meanwhile, the exhibition of a golden cross in the MACD yesterday signals the built-up of the stock's positive momentum.
Waiting for the stock to pull back to the range between RM1.03 and RM1.07 will be a good entry opportunity. The first resistance level is at RM1.08, and a successful breakout could see the stock testing RM1.18. On the flip side, if the stock dips below RM0.98, it could mean a false pattern breakout and the commencement of a correction phase.
Entry - RM1.03 - RM1.07
Stop Loss - RM0.93
Target Price - RM1.08 - RM1.18
Source: Mercury Securities Research - 3 Dec 2024
Related Stocks
| Chart | Stock Name | Last | Change | Volume |
|---|


