


MQTrader Education Series
MQ Trader Strategy – ADX Crossover

MQTrader Jesse
Publish date: Wed, 25 Jul 2018, 11:30 AM
What is Average Directional Index (ADX)?
Average Directional Index (ADX) is used to quantify trend strength. Three lines including Average Directional Index (ADX), Minus Directional Indicator (-DI) and Plus Directional Indicator (+DI) are formed to determine both trend direction and trend strength.
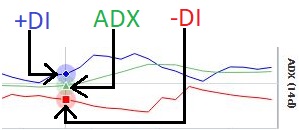
Source: MQ Trader Stock Analysis System
You may refer to ADX Calculation for more information.
How to quantify Trend Strength?
The value of ADX is very important for distinguishing between trending and non-trending conditions.
Table 1: The trend strength of ADX values
|
ADX Value |
Trend Strength |
|
0-25 |
Absent or Weak Trend |
|
25-50 |
Moderately Strong Trend |
|
50-75 |
Strong Trend |
|
75-100 |
Extremely Strong Trend |
Note: Low ADX value gives a sign of accumulation or distribution while high ADX value indicates an uptrend condition.
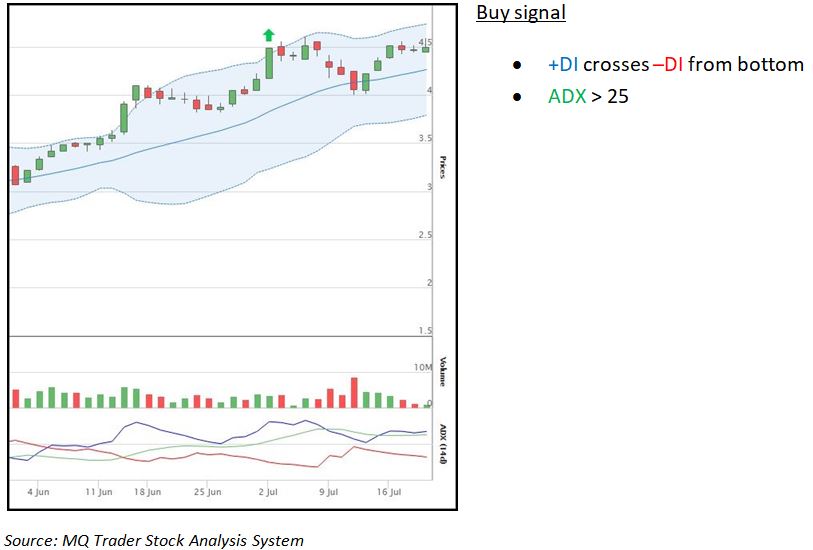
How to determine entry signal from ADX Crossover?
Green arrow will appear when there is a buy signal identified by our MQ Trader Stock Analysis System.
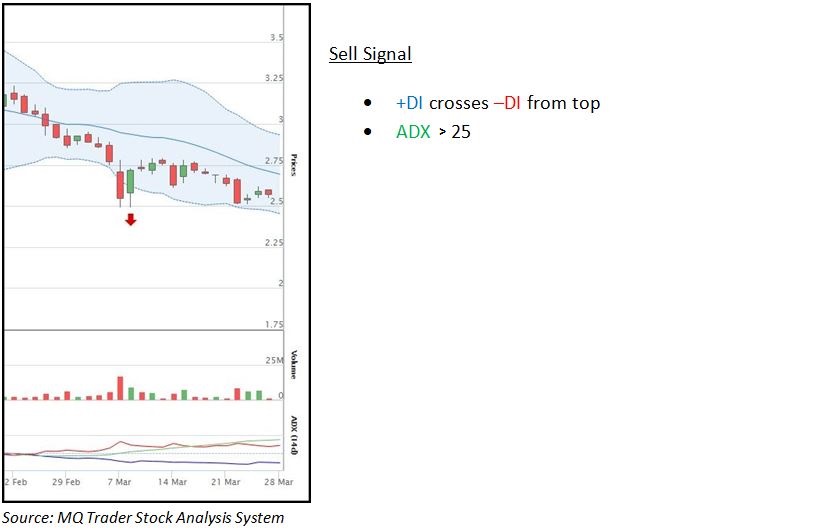
How to determine exit signal from ADX Crossover?
ADX Crossover on Supermax
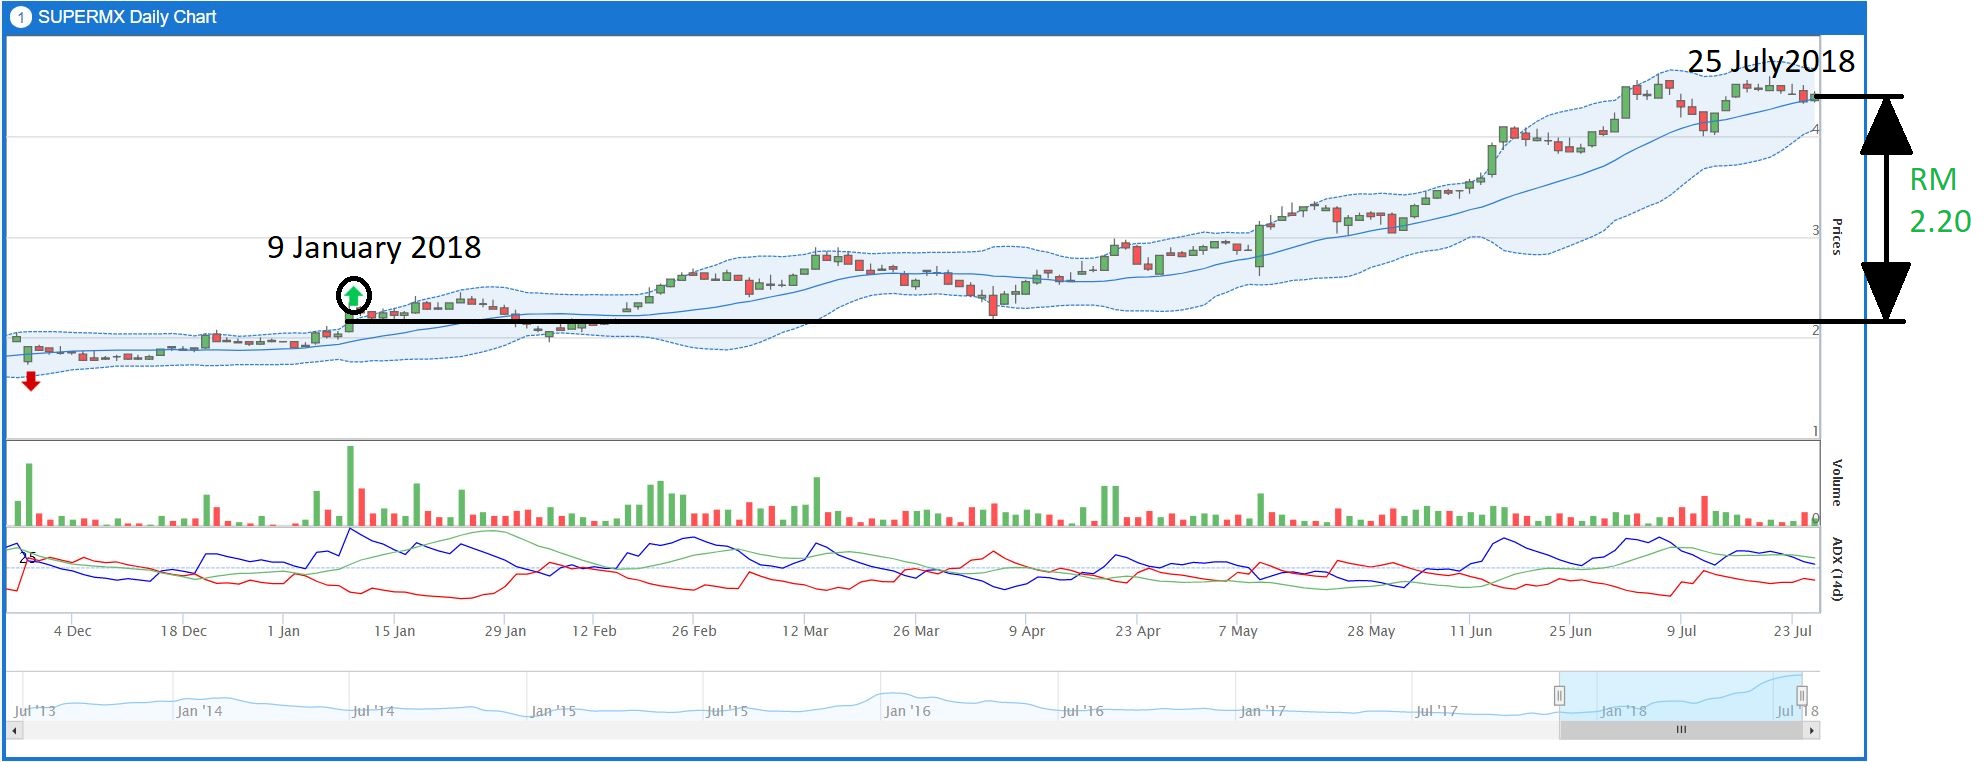
Figure 1: ADX Crossover Daily Chart where 1 candle represents price movement within a day.
RM2.20 per share of profit can be earned between 9th January 2018 till 25th July 2018 according to the buy signal in the system. There is no sell signal observed since 9th January 2018 showing that this stock has been experiencing long term uptrend price movement and this condition will keep going at the moment.
For traders who want to earn the profits within shorter time, shorter time basis of the charts (I.e. 30 minutes, Hourly) can be used, as there will be more candles within a day which can trigger more trading signals.To validate the possibility of the breakout, shorter duration of charts can be used to confirm the strength of the buy signal.
How to confirm trading signals?
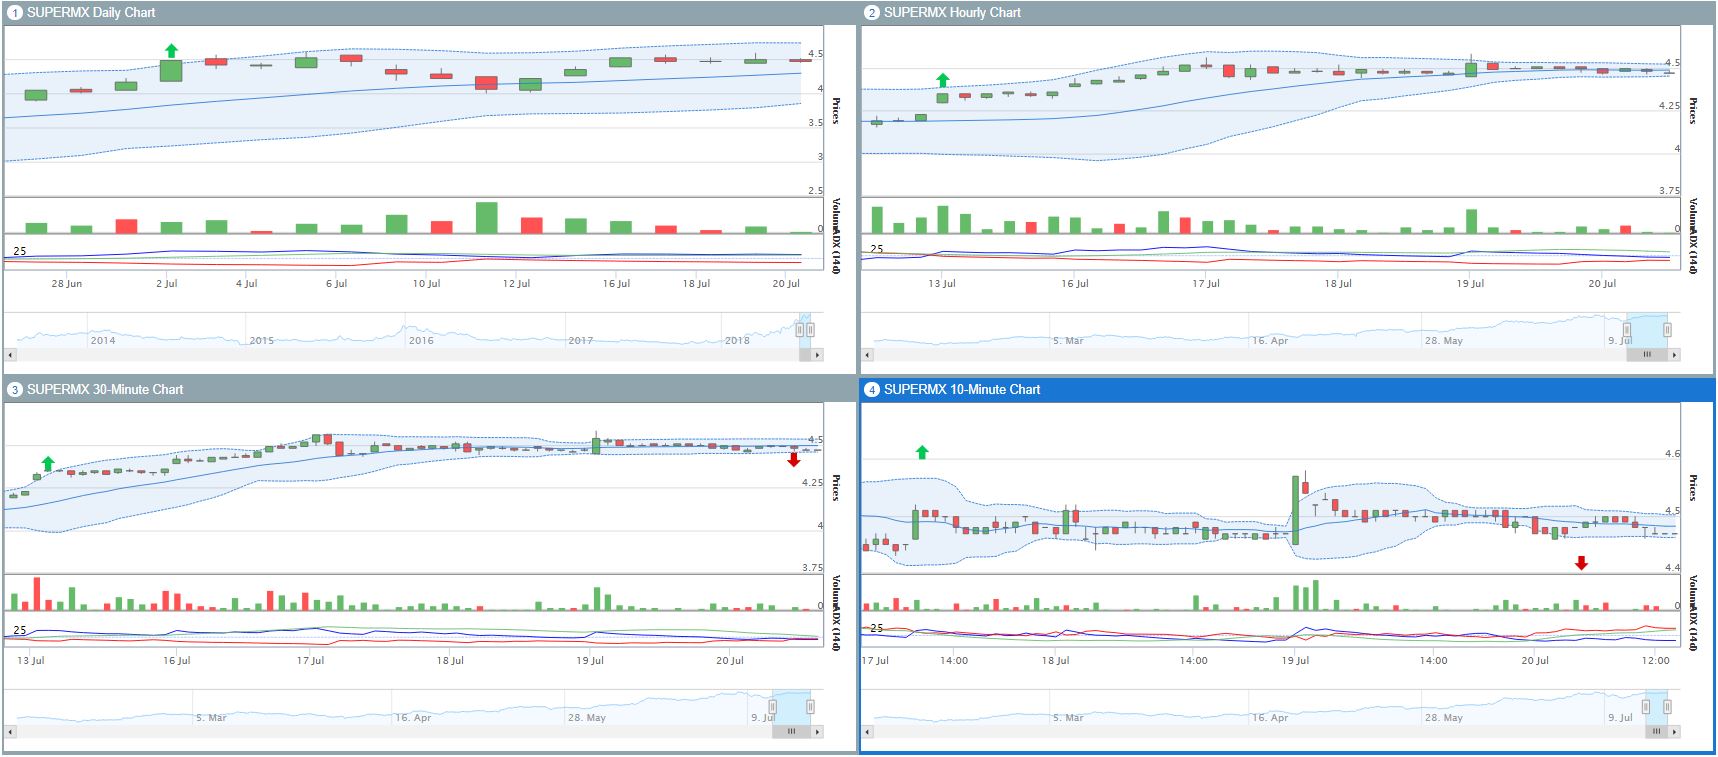
Figure 2: ADX Crossover on 20 July 2018: (1) Daily Chart (2) Hourly Chart (3) 30 Minutes Chart (4) 10 Minutes Chart.
One of the features of MQ Trader system enables us to view multiple technical charts (2 - 6 charts) on a single page in MQ Trader system. This allows us to compare the trading signals of charts with various time basis and technical indicators easily as demonstrated in Figure 2.
According to Figure 2 (a), a buy signal has been released on 2nd July 2018 but it does not tell whether it is still in uptrend at the moment. When we proceed to Hourly chart (Figure 2 (b)), it is showing that the buy signal appeared on 13th July 2018 but +DI is moving closer to -DI at the moment. Figure 2 (c) and (d) show a sell signal indicating the share price movement is approaching downtrend currently. Hence, we should start clearing our position at the moment instead, as the presence of sell signal has been confirmed.
Conclusion
ADX indicator calculations are complex but its interpretation is straightforward and practical. However, false signals might happen, as the crossover of +DI and DI- can occur quite frequently. Thus, different trading strategies including EMA 5 Crossover, MACD and RSI, OBV Breakout and Guppy MMA can be used to filter the false trading signals.
Community Feedback
We encourage traders to try out and evaluate the MQ Trader system and provide us feedback on the features you like to see in the system. We have received many positive feedbacks so far, and we are currently compiling and reviewing them for possible inclusion into the next release of the system.
We would like to develop this system based on community feedback to cater for community needs. Thanks to all those who have provided valuable feedback to us. Keep those feedbacks coming in!
Disclaimer
This article does not represent a BUY or SELL recommendation on the stock covered. Traders and Investors are encouraged to do their own analysis on stocks instead of blindly following any Trading calls raised by various parties in the Internet. We may or may not hold position in the stock covered, or initiate new position in the stock within the next 7 days.
Join us now!
MQ Trader stock analysis system uses Artificial Intelligence (AI), various technical indicators and quantitative data to generate accurate trading signals without the interference of human's emotions and bias against any particular stock. It comprises trading strategies which are very popular among fund managers for analysing stocks.
MQ Trader stock analysis system is SPONSORED for MQ Trader members. To use this amazing tool, you can sign up via MQ Trader Sign Up!
Contact us
Please do not hesitate to contact us if you have any enquiry:
Email: service@mqtrader.com
Related Stocks
| Chart | Stock Name | Last | Change | Volume |
|---|
More articles on MQTrader Education Series

Is there a safe haven to invest in a recessionary environment?
Created by MQTrader Jesse | Apr 13, 2023
MQ Trader - Why trade in a stock market that has strong currency?
Created by MQTrader Jesse | Aug 06, 2021
MQ Trader - How to validate buy signals by using MQ Live Backtesting? [ECOWLD]
Created by MQTrader Jesse | Nov 01, 2019
Featured Posts


Latest Videos


MQ Trading Signals
Time
Signal
Duration
Type
2025-02-04 15:10:00
EMA 5
5 Mins
SELL
2025-02-04 15:00:00
EMA 5
5 Mins
BUY
2025-02-04 12:25:00
EMA 5
5 Mins
SELL
2025-02-04 12:20:00
EMA 5
5 Mins
BUY
2025-02-04 10:20:00
EMA 5
10 Mins
SELL
Apps


Top Articles
1
THE INVESTMENT APPROACH OF CALVIN TAN
2
TA Sector Research
3
MQ Market Updates
4
M+ Online Research Articles
5
Initial Public Offering (IPO)
6
Mercury Securities Research
7
RHB Investment Research Reports
Construction - AI’s Turning Point Likely Positive For DC Builders
8
TA Sector Research
Sunway Real Estate Investment Trust - Poised for a Robust FY25
#
Stock
Score
Daily Stocks
Stock Name
Last
Change
Volume
Stock Name
Last
Change
Volume
Stock Name
Last
Change
Volume
Featured Advertisers / Partners


Ride The Bull Short The Bear
CS Tan
4.9 / 5.0
This book is the result of the author's many years of experience and observation throughout his 26 years in the stockbroking industry. It was written for general public to learn to invest based on facts and not on fantasies or hearsay....
Ron90
Supermax ..ADX+stochastic = clear indicator.. huhu
2018-07-25 12:16