It’s written in plain English and 6th grade math to make it easy to follow along. This is the strong point of the Magic Formula theme.
Everything is very easy to understand. The concept is simple, the explanation is simple, but most important of all, the execution for investors is simple enough to do on their own.
1. Establish a minimum market capitalization (usually greater than $50 million).
2. Exclude utility and financial stocks
3. Exclude foreign companies (American Depositary Receipts)
4. Determine company’s earnings yield = EBIT / enterprise value.
5. Determine company’s return on capital = ebit / (net fixed assets + working capital)
6. Rank all companies above chosen market capitalization by highest earnings yield and highest return on capital (ranked as percentages).
7. Invest in 20–30 highest ranked companies, accumulating 2–3 positions per month over a 12-month period.
8. Re-balance portfolio once per year, selling losers one week before the year-mark and winners one week after the year mark.
9. Continue over a long-term (3–5+ year) period.
Pay close attention to step 4 and 5 because they are the key driving formulas for it all to work.
Earnings Yield is used because it targets companies with below-average prices. The idea behind of Return on Capital is to select good companies that are outperforming. This fits in line with what Greenblatt said
a long-term investment strategy designed to help investors buy a group of above-average companies but only when they are available at below-average prices.
The Magical Performance
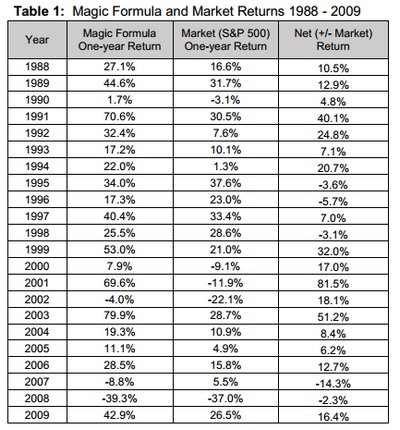
So how magic is this Magic Formula in terms of performance? This table of values is from the revised 2010 version of the book.

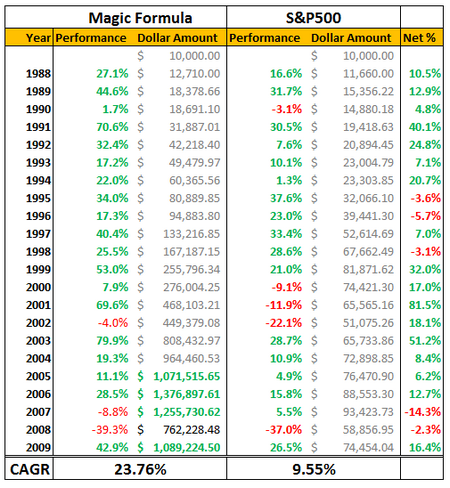
and a better representation.

Starting with $10,000 the Magic Formula would have made you a millionaire by 2009.
The Magic Formula is famous for returning a 30% CAGR. From 1988 to 2004, it did achieve a 30.8% return, but the CAGR has declined significantly. No strategy can sustain a CAGR of 30%. Although the backtest in the book only provides data up to 2009, I wouldn’t count on 2010-2012 results showing vast out-performance.
The Magic Formula is a Fraud?
By popular demand, the Magic Formula will soon be added to the list of value stock screens, but the one thing that has held it back is the reliability of the backtest performed by Greenblatt.
I just don’t believe the results are as good as it seems.
What’s more, other blogs have tried to simulate the Magic Formula performance from the book, but none of them have come close.
Backtesting the Magic Formula Using Portfolio123
Portfolio123 has a very good predefined Magic Formula screen which I’m going to use for some more numbers and graphs.
Although the screen uses the same fundamental formula and tries to follow the Little Book, it ends up being slightly different to Greenblatt’s version.
Here is how the screen is constructed.
-
No OTC stocks
-
No ADR’s
-
No financial companies
-
No utilities
-
No real estate companies
-
Market cap greater than $50m
-
5 year average of ROI ranks in the top 35%
-
Slippage of 2%
-
Carry cost of 1%
-
100% long
-
Stocks selected based on ranking of Earnings Yield = EBIT / Enterprise Value and Return on Capital = EBIT / (Net Fixed Assets + Working Capital)
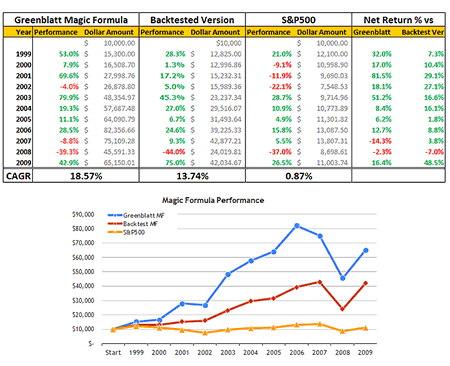
To try and compare apples to apples, data from 1999 to 2009 is used as the data only goes back as far as 1999, and 2009 is the latest year provided in Greenblatt’s Book.
(click to enlarge)


Although the backtest version kills the market over the same period, it doesn’t match or beat the Greenblatt version.
However, if I adjust the slippage to 0%, it comes awfully close. CAGR over the same period then becomes 17.33%, which is oh so close to the original 18.57%.
But I’m willing to bet that the original formula does not include factors such as fees and slippage in the results. If it did, it would fall to a level similar to my backtested results.
Either way, there goes my earlier comment about not believing in the results.
Sure it’s not the 30%+ CAGR that Greenblatt wrote about in the book, but there is magic in the air.


