Revealing My Action Score Stock and the Dilemma of Selling - Jae Jun
Tan KW
Publish date: Tue, 23 Oct 2018, 05:34 PM
October 23, 2018
What You’ll Learn
- What to do when stocks are trading above fair value
- My thought process about buying & selling based on the OSV action score
In the last email I showed how the US market is a cut above the rest of the world. It’s been performing admirably since.
Another interesting tidbit is how the markets have performed during midterm elections.
Check this out.
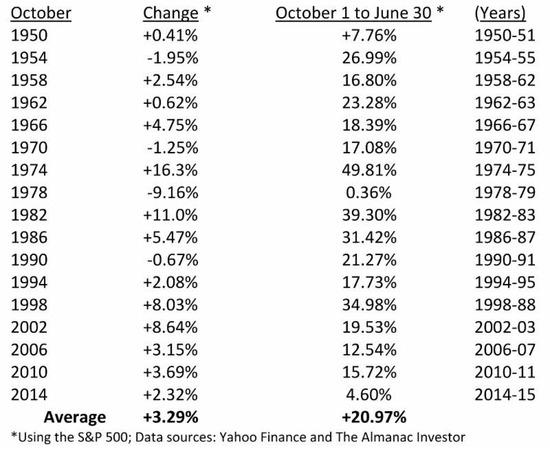
Using simple averages, in each of the midterm election years from 1950 to 2014, the market averaged nearly 21% gains between October 1 and June 30. Over these 3 quarters, not a single down period.
It may feel like looking at the roulette screen and betting based on the previous rolls, but the consistency and performance is just uncanny.
So let’s say the market has a good chance to continue on up from here for the next 90 days.
The question that I’m asked frequently is what to do with the stocks that are trading far above what I deem as fair value.
In other words, what do you do when the stock price looks overvalued, but the Action Score says it’s a buy?
Here’s an example of a current holding of mine.
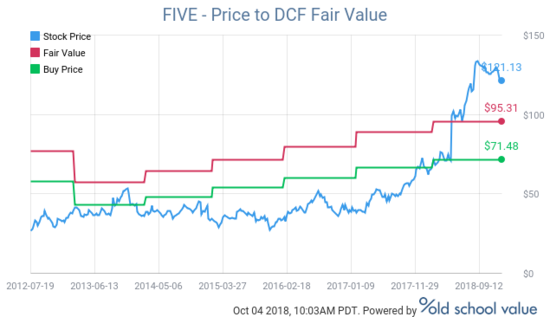
Right off the bat you can see that the stock price now lies in overvalued territory according to the DCF model. But just because a stock looks overvalued with a model, it does not mean it is an F score stock.
Here’s some context on why that is.
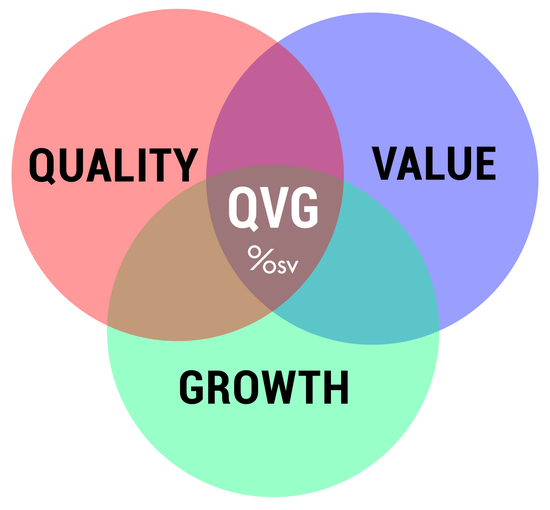
FIVE is a stock that showed up this year in the list of “Munger Stocks”.
These are stocks categorized with high ranks in the Growth and Quality score, with the value score being the weakest.
The filters in the Munger Screen are set to simply look for Quality and Growth, over value.
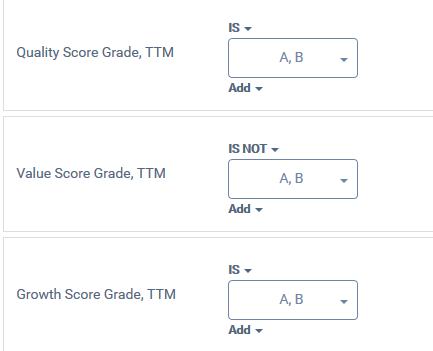
I don’t like to call the Munger stocks, “growth stocks”, because until this year, FIVE has been under the radar. These types of stocks are simply companies that offer quality along with growth. I’ve hinted throughout the year that these are the stocks you should be looking at in 2018.
FIVE is still rated a B.
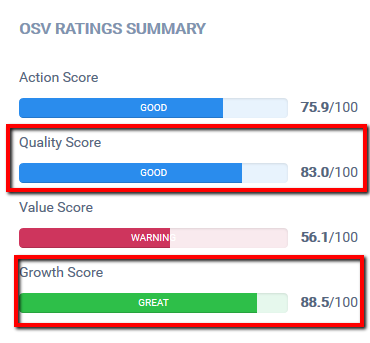
And this looks contradictory to where the stock price is hovering.
The DCF chart above shows it to be overvalued, but the Action Score says it’s a B and worth looking into.
The counter-intuitive part as a value investor is that a lot of my focus, or habit to put it correctly, has anchored on price rather than a balance of other components.
It’s a lot like how I used to pick things to buy. I’d go for the cheapest and then when it breaks, I’ll have to buy another one – equivalent to value traps.
Instead, if I paid a slightly undervalued to decent price for a product or service, I can expect it to work out well.
The Action Score helps to qualify and quantify stocks in this way. It says “hey, this company has more to offer than just price”.
So going back to FIVE.
Regardless of what the market is going to do for the next 3 quarters, FIVE has gone up too high, too fast and I’ll be taking some off the table.
I’ll be happy to lock in some 70% gains in less than a year and let the rest of the position ride the Action Score.
But I won’t be selling out completely because based on the rules of the OSV Action Scores, it’s better to hold while the Action score is still an A or B.
At the same time, I also won’t be buying more because again, it’s gone up too high and fast.
The Action Score currently shows the company to be growing quickly, but what it can’t show is what will happen to the stock going forward as it gets more attention and traders start to pile in.
This is not a hard and fast rule, and selling has always been the toughest part of the equation for me.
It involves just as much art and science as buying, except the emotional level is ratcheted up another level because an emotional variable has been added to the investment equation.
That is, whether you’re in positive or negative territory.
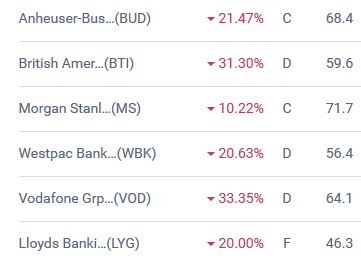
Inversely, there are stocks that are rated C or D class, with a chart that looks very undervalued, but these are not all immediate buys.
If you look at the 52 week low stocks, they may look cheap or undervalued, but they are nearly all ranked C and below.
TJX Article by OSV Member
I also want to bring your attention to an older article and analysis on TJX written by an OSV Insider.
It’s a good way to see how other members are thinking through the process. I like this analysis because it’s simple and it just makes sense.
Use it as a “before” picture of TJX back in April when it was written and check it against the now.
You’ll see why using a single valuation model to determine a stock is overvalued or not can be wrong.
As we dive into Q4, if you are not a member to Old School Value yet, check out the demo with the link below.
Consider joining to find these types of Munger Stocks before it hits the radar of Wall Street and get a head start into 2019.
What is Old School Value?
Old School Value is a suite of value investing tools designed to fatten your portfolio by identifying what stocks to buy and sell.
It is a stock grader, value screener, and valuation tools for the busy investor designed to help you pick stocks 4x faster.
https://www.oldschoolvalue.com/blog/investing-perspective/revealing-action-score-stock-dilemma-selling/
More articles on OldSchool.com - Jae Jun
Created by Tan KW | Jun 14, 2018
Created by Tan KW | Apr 20, 2018


