Hang Seng Index Futures - Sentiment Remains Positive
rhboskres
Publish date: Fri, 25 Jan 2019, 04:59 PM

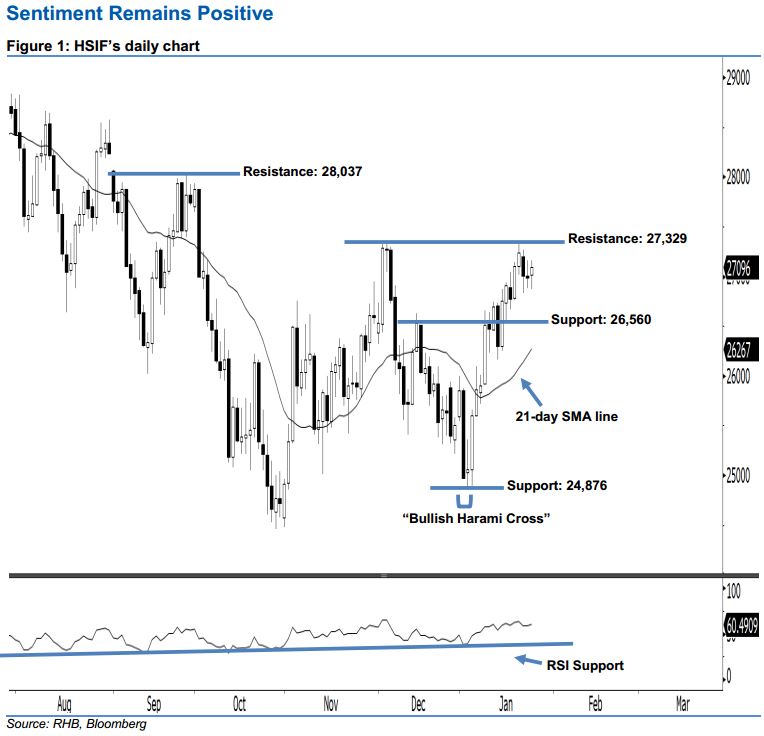
Stay long, with a trailing-stop set below the 26,560-pt support. The upward movement of the HSIF continued as expected, as a white candle was formed yesterday. It closed at 27,096 pts, off the session’s low of 26,872 pts. Technically speaking, we think the upward momentum is still present, as the index marked a higher close above the rising 21-day SMA line. In addition, as the 14-day RSI indicator is now rising higher without being overbought, this indicates that the upside move remains valid. Overall, we remain bullish on the HSIF’s outlook.
Based on the daily chart, the immediate support level is seen at 26,560 pts, situated near the midpoint of 15 Jan’s white candle. If this level is taken out, look to 24,876 pts – ie the low of 3 Jan’s “Bullish Harami Cross” pattern – as the next support. To the upside, we are eyeing the immediate resistance level at 27,329 pts, which was the high of 4 Dec 2018. The next resistance is seen at 28,037 pts, defined from the previous high of 26 Sep 2018.
Thus, we advise traders to stay long, given that we previously recommended initiating long above the 26,000-pt level on 10 Jan. In the meantime, a trailing-stop can be set below the 26,560-pt threshold in order to lock in part of the profits.
Source: RHB Securities Research - 25 Jan 2019
More articles on RHB Retail Research
Created by rhboskres | Aug 26, 2024


