Hang Seng Index Futures - Maintain Long Positions
rhboskres
Publish date: Thu, 11 Jul 2019, 05:16 PM

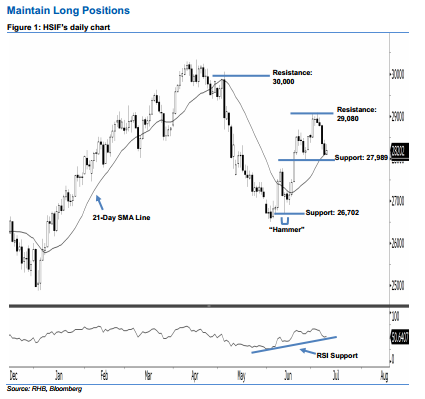
Stay long, while setting a trailing-stop below the 27,989-pt support. After posting four black candles in a row, the HSIF ended higher to form a positive candle yesterday. It closed at 28,202 pts, after oscillating between a high of 28,345 pts and low of 28,087 pts. From a technical viewpoint, the bullish sentiment remains intact. This was after the index continued to stay above the previously-indicated 27,989-pt support and rising 21-day SMA line. Furthermore, as the 14-day RSI indicator turned higher for a better reading at 50.64 pts as of yesterday, the bullish sentiment has been enhanced. Overall, we stay bullish on the HSIF’s outlook.
Based on the daily chart, the immediate support is seen at 27,989 pts, ie the low of 26 Jun. If this level is taken out, look to 26,702 pts – the low of 13 Jun’s “Hammer” pattern – as the next support. To the upside, we are eyeing the immediate resistance at 29,080 pts, ie the high of 4 Jul. Meanwhile, the next resistance will likely be at the 30,000- pt psychological spot, which is also set near the high of 6 May’s long black candle.
Therefore, we advise traders to stay long, following our recommendation of initiating long above the 27,436-pt level on 12 Jun. A trailing-stop can be set below the 27,989-pt level to lock in part of the profits.
Source: RHB Securities Research - 11 Jul 2019
More articles on RHB Retail Research
Created by rhboskres | Aug 26, 2024


