


RHB Retail Research
Trading Stocks - IJM Corporation

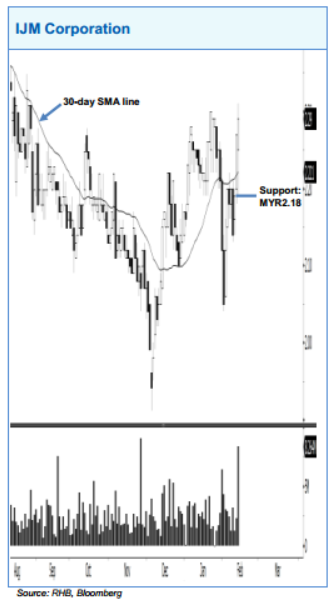
IJM formed a white candle, breaking away from the 30-day SMA line with a strong trading volume – which indicates that its uptrend may be resuming. A positive bias may emerge above the MYR2.18 support level, while resistance levels are at MYR2.35 and MYR2.50. A stop-loss can be placed below MYR2.18.
Source: RHB Securities Research - 14 Feb 2020
Related Stocks
| Chart | Stock Name | Last | Change | Volume |
|---|
Market Buzz
2024-11-25
IJM2024-11-24
IJM2024-11-22
IJM2024-11-22
IJM2024-11-22
IJM2024-11-21
IJM2024-11-21
IJM2024-11-21
IJM2024-11-20
IJM2024-11-20
IJM2024-11-19
IJM2024-11-18
IJM2024-11-18
IJM2024-11-15
IJM2024-11-15
IJM2024-11-15
IJM2024-11-15
IJM2024-11-14
IJM2024-11-14
IJM2024-11-14
IJM2024-11-13
IJM2024-11-13
IJM2024-11-13
IJM2024-11-13
IJM2024-11-12
IJM2024-11-12
IJM2024-11-12
IJM2024-11-12
IJMMore articles on RHB Retail Research
Duopharma Biotech - Lacking Near-Term Re-Rating Catalysts; D/G NEUTRAL
Created by rhboskres | Aug 26, 2024
Discussions
Be the first to like this. Showing 0 of 0 comments
Post a Comment
Featured Posts


Latest Videos


MQ Trading Signals
Time
Signal
Duration
Type
2024-11-25 08:00:00
EMA 5
Daily
BUY
Apps


Top Articles
1
3
4
5
save malaysia!
Visa-free travel to China extended for Malaysians to 30 days
6
7
Good Articles to Share
Four convicted in Spain over homophobic murder that sparked nationwode protests
8
Good Articles to Share
#
Stock
Score
Daily Stocks
Stock Name
Last
Change
Volume
Stock Name
Last
Change
Volume
Stock Name
Last
Change
Volume
Featured Advertisers / Partners


Ride The Bull Short The Bear
CS Tan
4.9 / 5.0
This book is the result of the author's many years of experience and observation throughout his 26 years in the stockbroking industry. It was written for general public to learn to invest based on facts and not on fantasies or hearsay....