


The Alpha Trader
KINERGY ADVANCEMENT BERHAD) (0193) - A CAPITULATION TRADE SETUP

TheAlphaTrader
Publish date: Fri, 16 Aug 2024, 02:59 PM
TheAlphaTrader
0 53
With over 20 years of trading experience in financial markets, this blog is intended to share with fellow traders how I identify good trade setups from a combination of fundamental, technical and situational considerations
TECHNICAL OUTLOOK
DAILY CHART
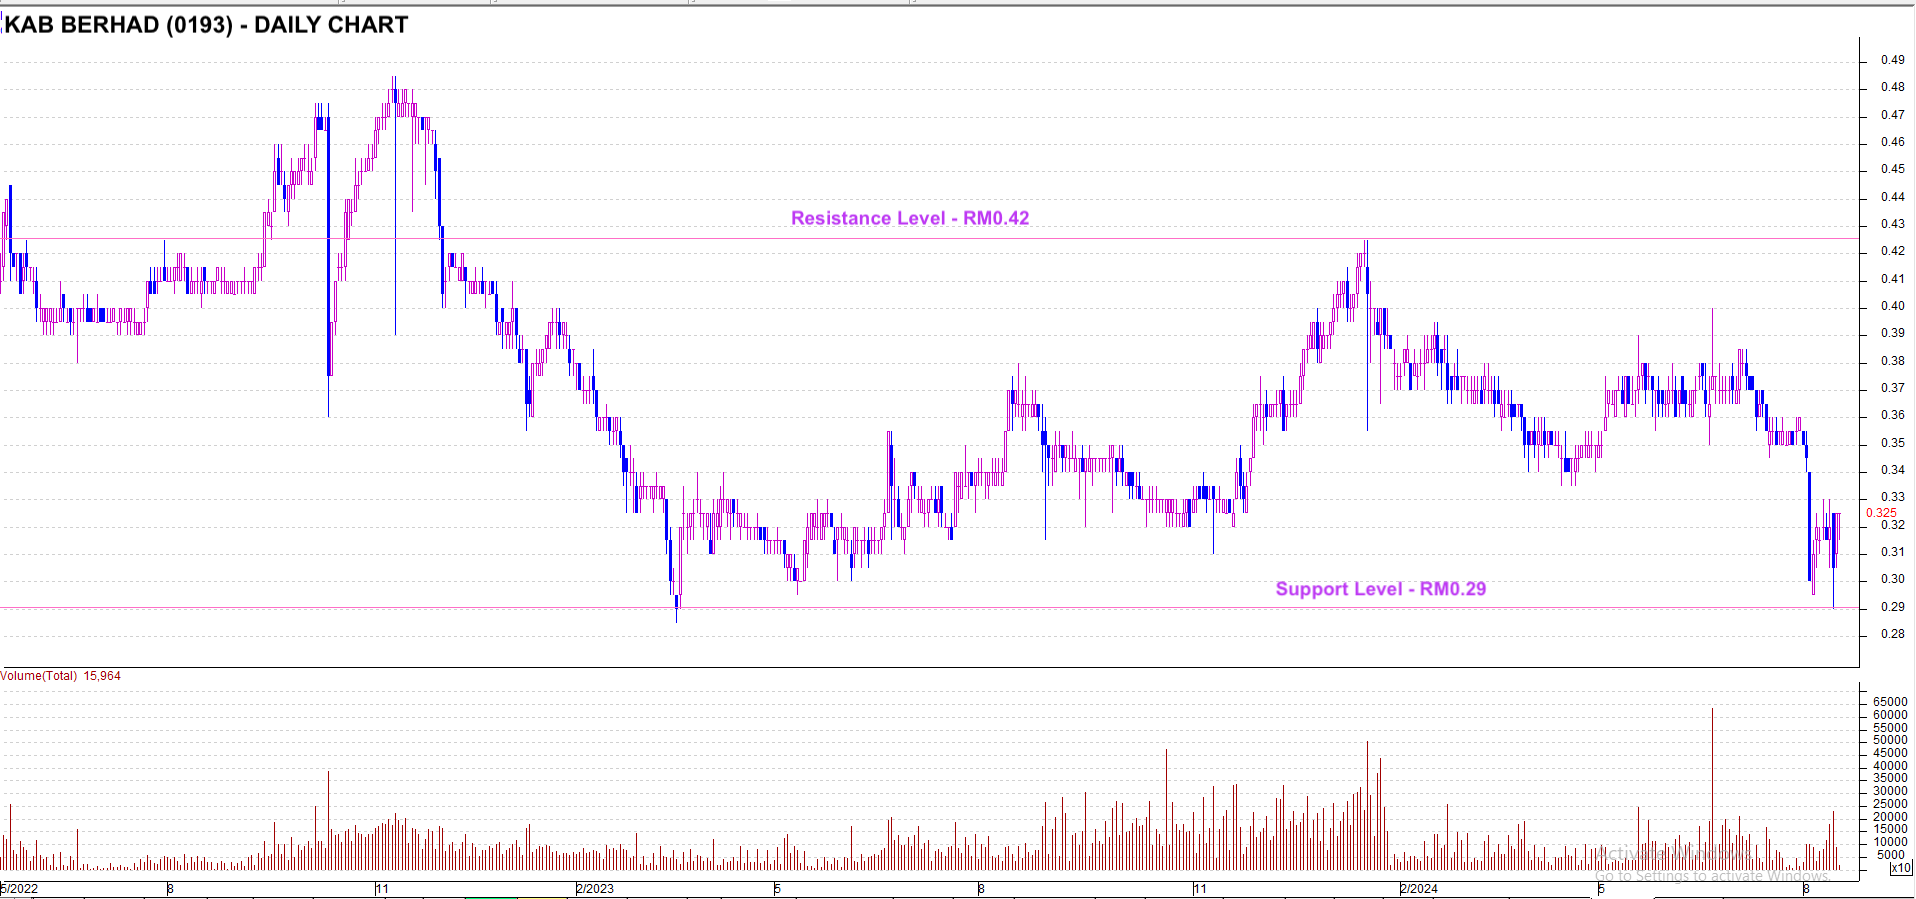
Looking back from Jan 2022, KAB has shown a clear sideways pattern with strong support at the RM0.29 level and resistance at RM0.42. Why is this significant? In the last two and the half years, the critical RM0.29 has only been tested on two occasions, and this was again revisited on 14 August 2024, while the upper boundary of RM0.42 was tested once in the same period in January 2024.
Analysing the recent selldown on 14 August, we can see selling exhaustion and capitulation type behaviour where the bears were trying to force a breakdown of the RM0.29 on increased volume, but the bulls defended the support well resulting in a close above the key support at RM0.305. Yesterday’s trading did not even retest the RM0.29 but instead, managed to close at day highs of RM0.325, further confirming that selling exhaustion is indeed in place from the previous day.
WEEKLY CHART
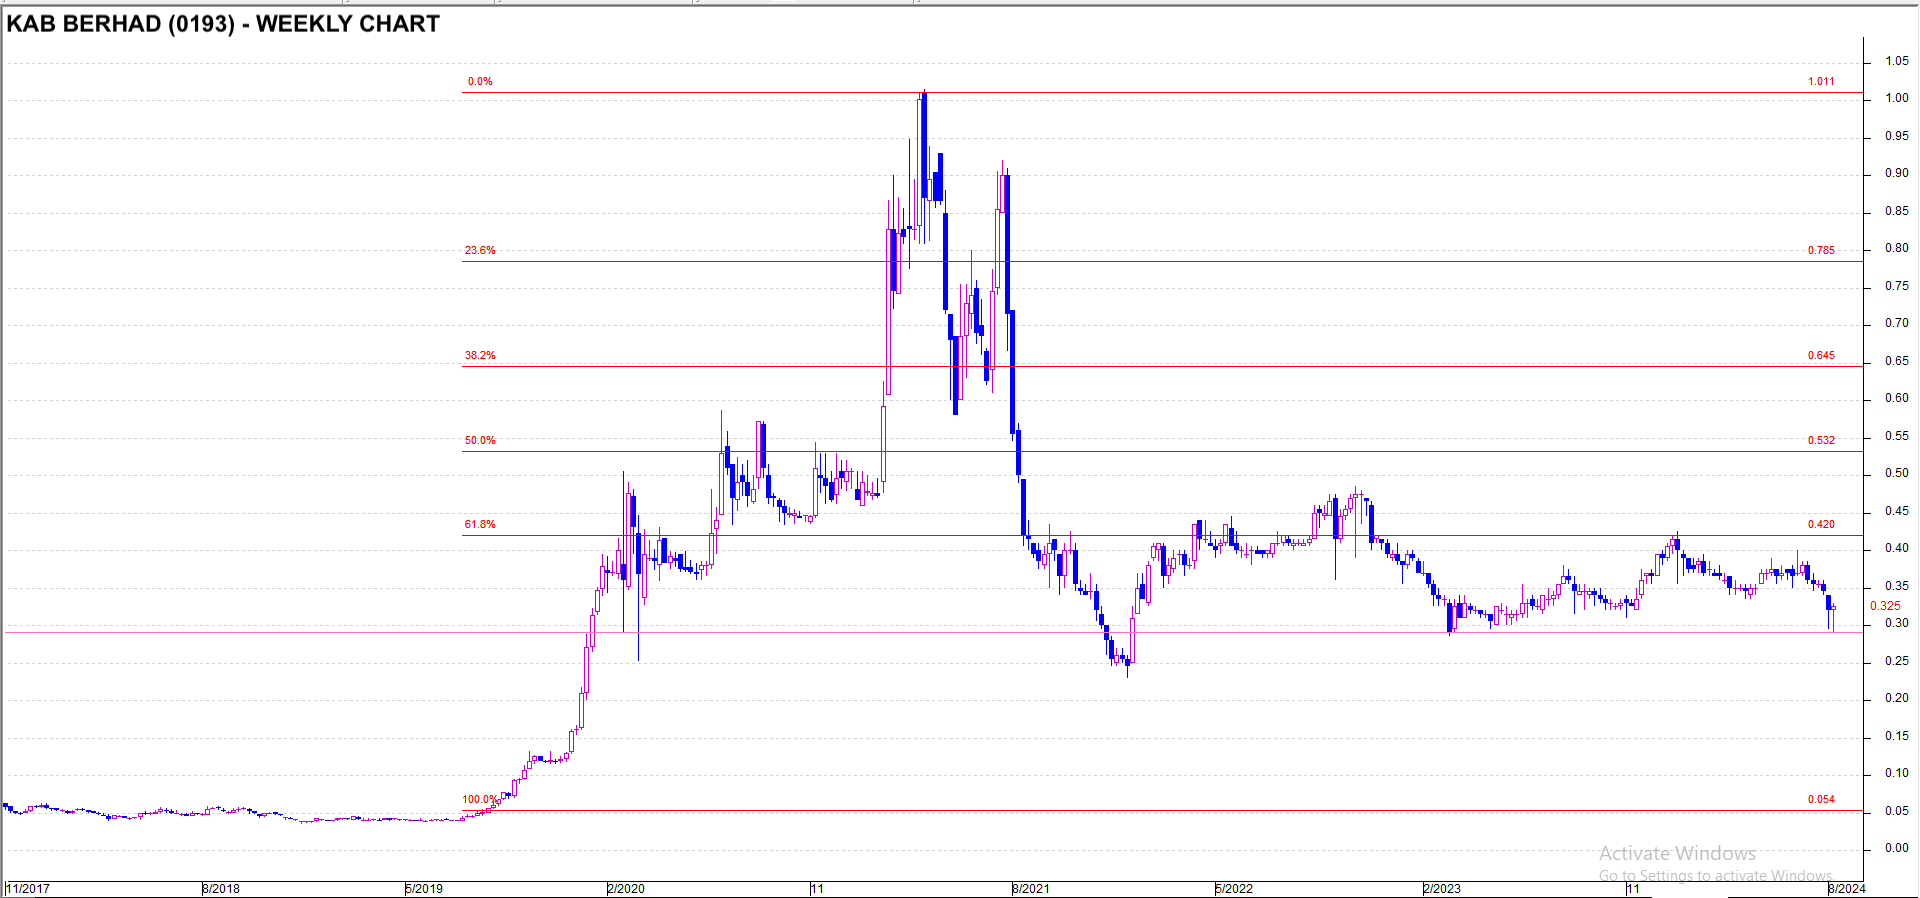
Drilling into the longer term weekly chart, we see that KAB has fallen 70% from its all time high of RM1.01, which was reached back in April 2021. This was probably due to the overly speculation on the prospect of renewable energy plays during that period. Worthy to note also, the original move started at a mere RM0.05, which made it a 20 bagger at the highs!
Looking at fibonacci retracement gives an insight to potential price regions of interest. So, taking a base of RM0.05 and the highs of RM1.01, we can obtain four good levels to analyse and possible targets to aim for on the upside. First level would be RM0.42, which represents the 61.8% fibonacci levels from the all time highs. This is coincidentally also represents the resistance level derived from the daily chart. Should this level be broken to the upside, the next level level would be at RM0.53, representing the 50% retracement level.
SUMMARY
From a technical basis, the current price of RM0.325 represents a very good risk to reward trade as we have a potential minimum upside of RM0.42, versus a downside risk of RM0.29.
Disclaimer: This blog is created for sharing of trading ideas only. It is not in any way or form meant to be an inducement or recommendation to buy or sell any stocks. Consult your financial consultant before making any financial investments.
Related Stocks
| Chart | Stock Name | Last | Change | Volume |
|---|
More articles on The Alpha Trader
E.A. TECHNIQUE BERHAD (5259) - TRADING IDEA: HUGE POSSIBLE UPSIDE ON UPCOMING PN17 EXIT?
Created by TheAlphaTrader | Nov 20, 2024
CRUDE PALM OIL PRICES ARE AT TWO YEAR HIGHS! WILL THE TREND CONTINUE?
Created by TheAlphaTrader | Nov 01, 2024
KINERGY ADVANCEMENT BERHAD (0193) - BREAKING OUT OF CONSOLIDATION RANGE
Created by TheAlphaTrader | Oct 01, 2024
E.A. TECHNIQUE BERHAD (5259) WHITE KNIGHT RESCUE PLAN COMPLETED SO WHAT'S NEXT?
Created by TheAlphaTrader | Jul 27, 2024
LOTTE CHEMICAL TITAN HOLDING BERHAD (5284) - WHY THE RECENT INTEREST IN THIS STOCK?
Created by TheAlphaTrader | Jun 21, 2024
ANCOM NYLEX BHD (4758) - PRICE IS BREAKING OUT OF CONSOLIDATION ZONE
Created by TheAlphaTrader | Jun 07, 2024
PARAGON UNION BHD (9407) - A BLUE CHIP COMPANY IN THE MAKING?
Created by TheAlphaTrader | May 31, 2024
Featured Posts
Introducing MY's First IPO Fund for Sophisticated Investors!
New Update. Discover investment communities that resonate with your ideas
M & A Value Partners IPO Equity Fund has been launched - Targeted 13% Return p.a
Latest Videos


Apps


Top Articles
1
Mercury Securities Research
2
Stock Market Enthusiast
3
THE INVESTMENT APPROACH OF CALVIN TAN
4
5
Phillip Capital Research Reports
6
save malaysia!
7
Good Articles to Share
8
Good Articles to Share
#
Stock
Score
Daily Stocks
Stock Name
Last
Change
Volume
Stock Name
Last
Change
Volume
Stock Name
Last
Change
Volume
Featured Advertisers / Partners


Ride The Bull Short The Bear
CS Tan
4.9 / 5.0
This book is the result of the author's many years of experience and observation throughout his 26 years in the stockbroking industry. It was written for general public to learn to invest based on facts and not on fantasies or hearsay....
berbolabiru
used to have respect on your contents..
2024-08-18 14:23