


US portfolio
Technical Analysis of BloomZ Inc. (BLMZ) Stock Chart

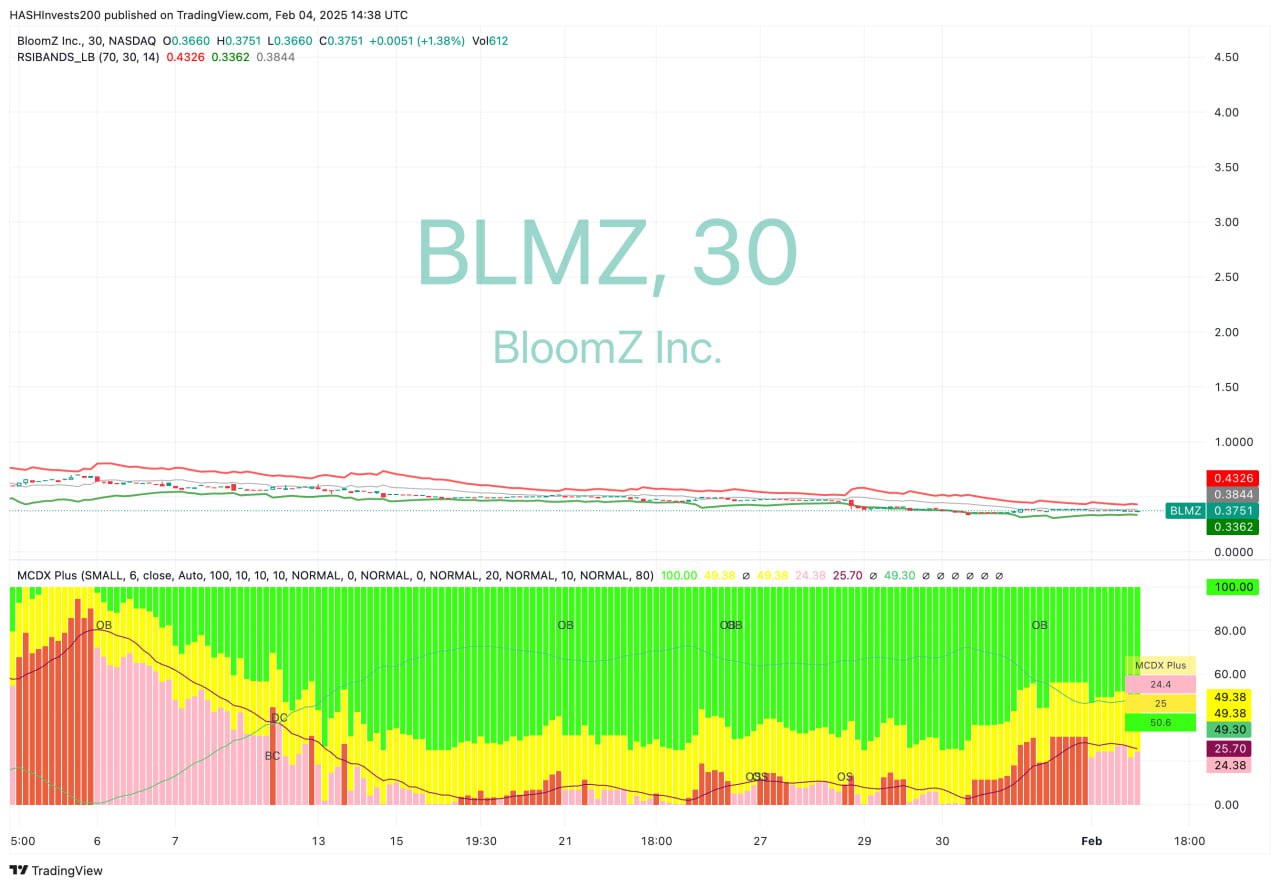
BloomZ Inc. (BLMZ) has been trading in a narrow range, closing at $0.3751 with a modest +1.38% gain. Resistance is near $0.4326, while support sits around $0.3362, indicating a consolidation phase with low volatility.
The RSI Bands suggest the stock is neither overbought nor oversold, with a breakout above $0.3844 potentially signaling bullish momentum. Meanwhile, the MCDX Plus indicator shows that 49.38% of activity is buying-driven, while 24.38% reflects selling pressure, which has been gradually declining.
If BLMZ sustains above $0.3751 and surpasses $0.3844, an uptrend toward $0.40-$0.43 could follow. However, failure to hold may lead to a retest of $0.3362 support. Volume remains low, so traders should watch for stronger buying signals before committing to a bullish stance.
More articles on US portfolio
Discussions
Be the first to like this. Showing 0 of 0 comments
Post a Comment
Featured Posts


Latest Videos


Apps


Top Articles
1
M+ Online Research Articles
2
Initial Public Offering (IPO)
3
博傻理论
4
TA Sector Research
5
Mercury Securities Research
6
RHB Investment Research Reports
7
RHB Investment Research Reports
Construction - AI’s Turning Point Likely Positive For DC Builders
8
Bimb Research Highlights
MALAYSIA TOURISM - SHARIAH COMPLIANT EQUITY RESEARCH January 2025
#
Stock
Score
Daily Stocks
Stock Name
Last
Change
Volume
Stock Name
Last
Change
Volume
Stock Name
Last
Change
Volume
MQ Trading Signals
Stock
Time
Signal
Duration
Stock
Time
Signal
Duration
Featured Advertisers / Partners


Ride The Bull Short The Bear
CS Tan
4.9 / 5.0
This book is the result of the author's many years of experience and observation throughout his 26 years in the stockbroking industry. It was written for general public to learn to invest based on facts and not on fantasies or hearsay....