AmInvest Research Reports
Stock on Radar - SDS Group (SDS)
AmInvest
Publish date: Wed, 02 Oct 2024, 08:51 AM
SDS Group (SDS | 0212)
Last Price: RM1.27 | Technical Call: BUY

| Support 1: RM1.24 | Resistance 1: RM1.40 |
| Support 2: RM1.13 | Resistance 2: RM1.50 |
| Shariah Compliant: Yes | Sector: Consumer |
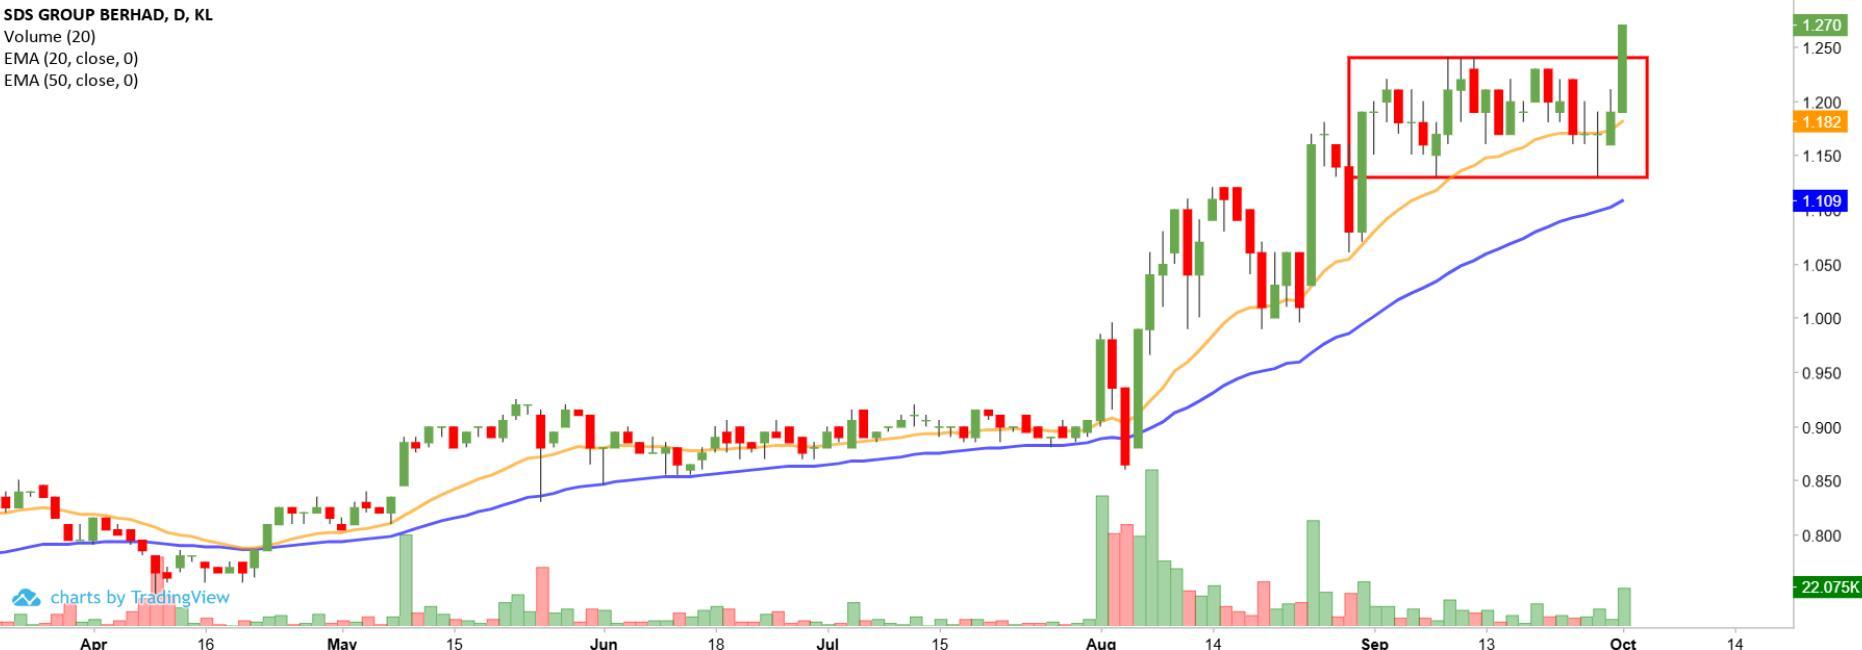
SDS Group's buying interest is back after it broke out of the 1-month bullish rectangle pattern with a long positive candle yesterday. The stock also posted two positive candles in a row and hit a new all-time high, likely suggesting that upward momentum is picking up further. A bullish bias may emerge above the RM1.24 level with stop-loss set at RM1.11, below the 27
Sep low. Towards the upside, near-term resistance level is seen at RM1.40, followed by RM1.50.
Entry: RM1.24-1.27
Target: RM1.40, RM1.50
Exit: RM1.11
Source: AmInvest Research - 2 Oct 2024
Related Stocks
| Chart | Stock Name | Last | Change | Volume |
|---|
More articles on AmInvest Research Reports
Petronas Chemicals - Closing in to floor on multi-year low foreign holdings
Created by AmInvest | Nov 21, 2024
Discussions
Be the first to like this. Showing 0 of 0 comments


