CHINWEL - Where is the next target?
DividendGuy67
Publish date: Sat, 18 May 2024, 11:02 AM
I previously blogged about CHINWEL here when it was trading near 1.18 where I shared this was my accumulation zone and it's important to try to get to a full position around here.
To my pleasant surprise (not unexpected), CHINWEL found support there and then run up sooner that I had allowed for, to close at 1.31 yesterday. Typically, traders will be looking out for the next resistance. Where might that be?
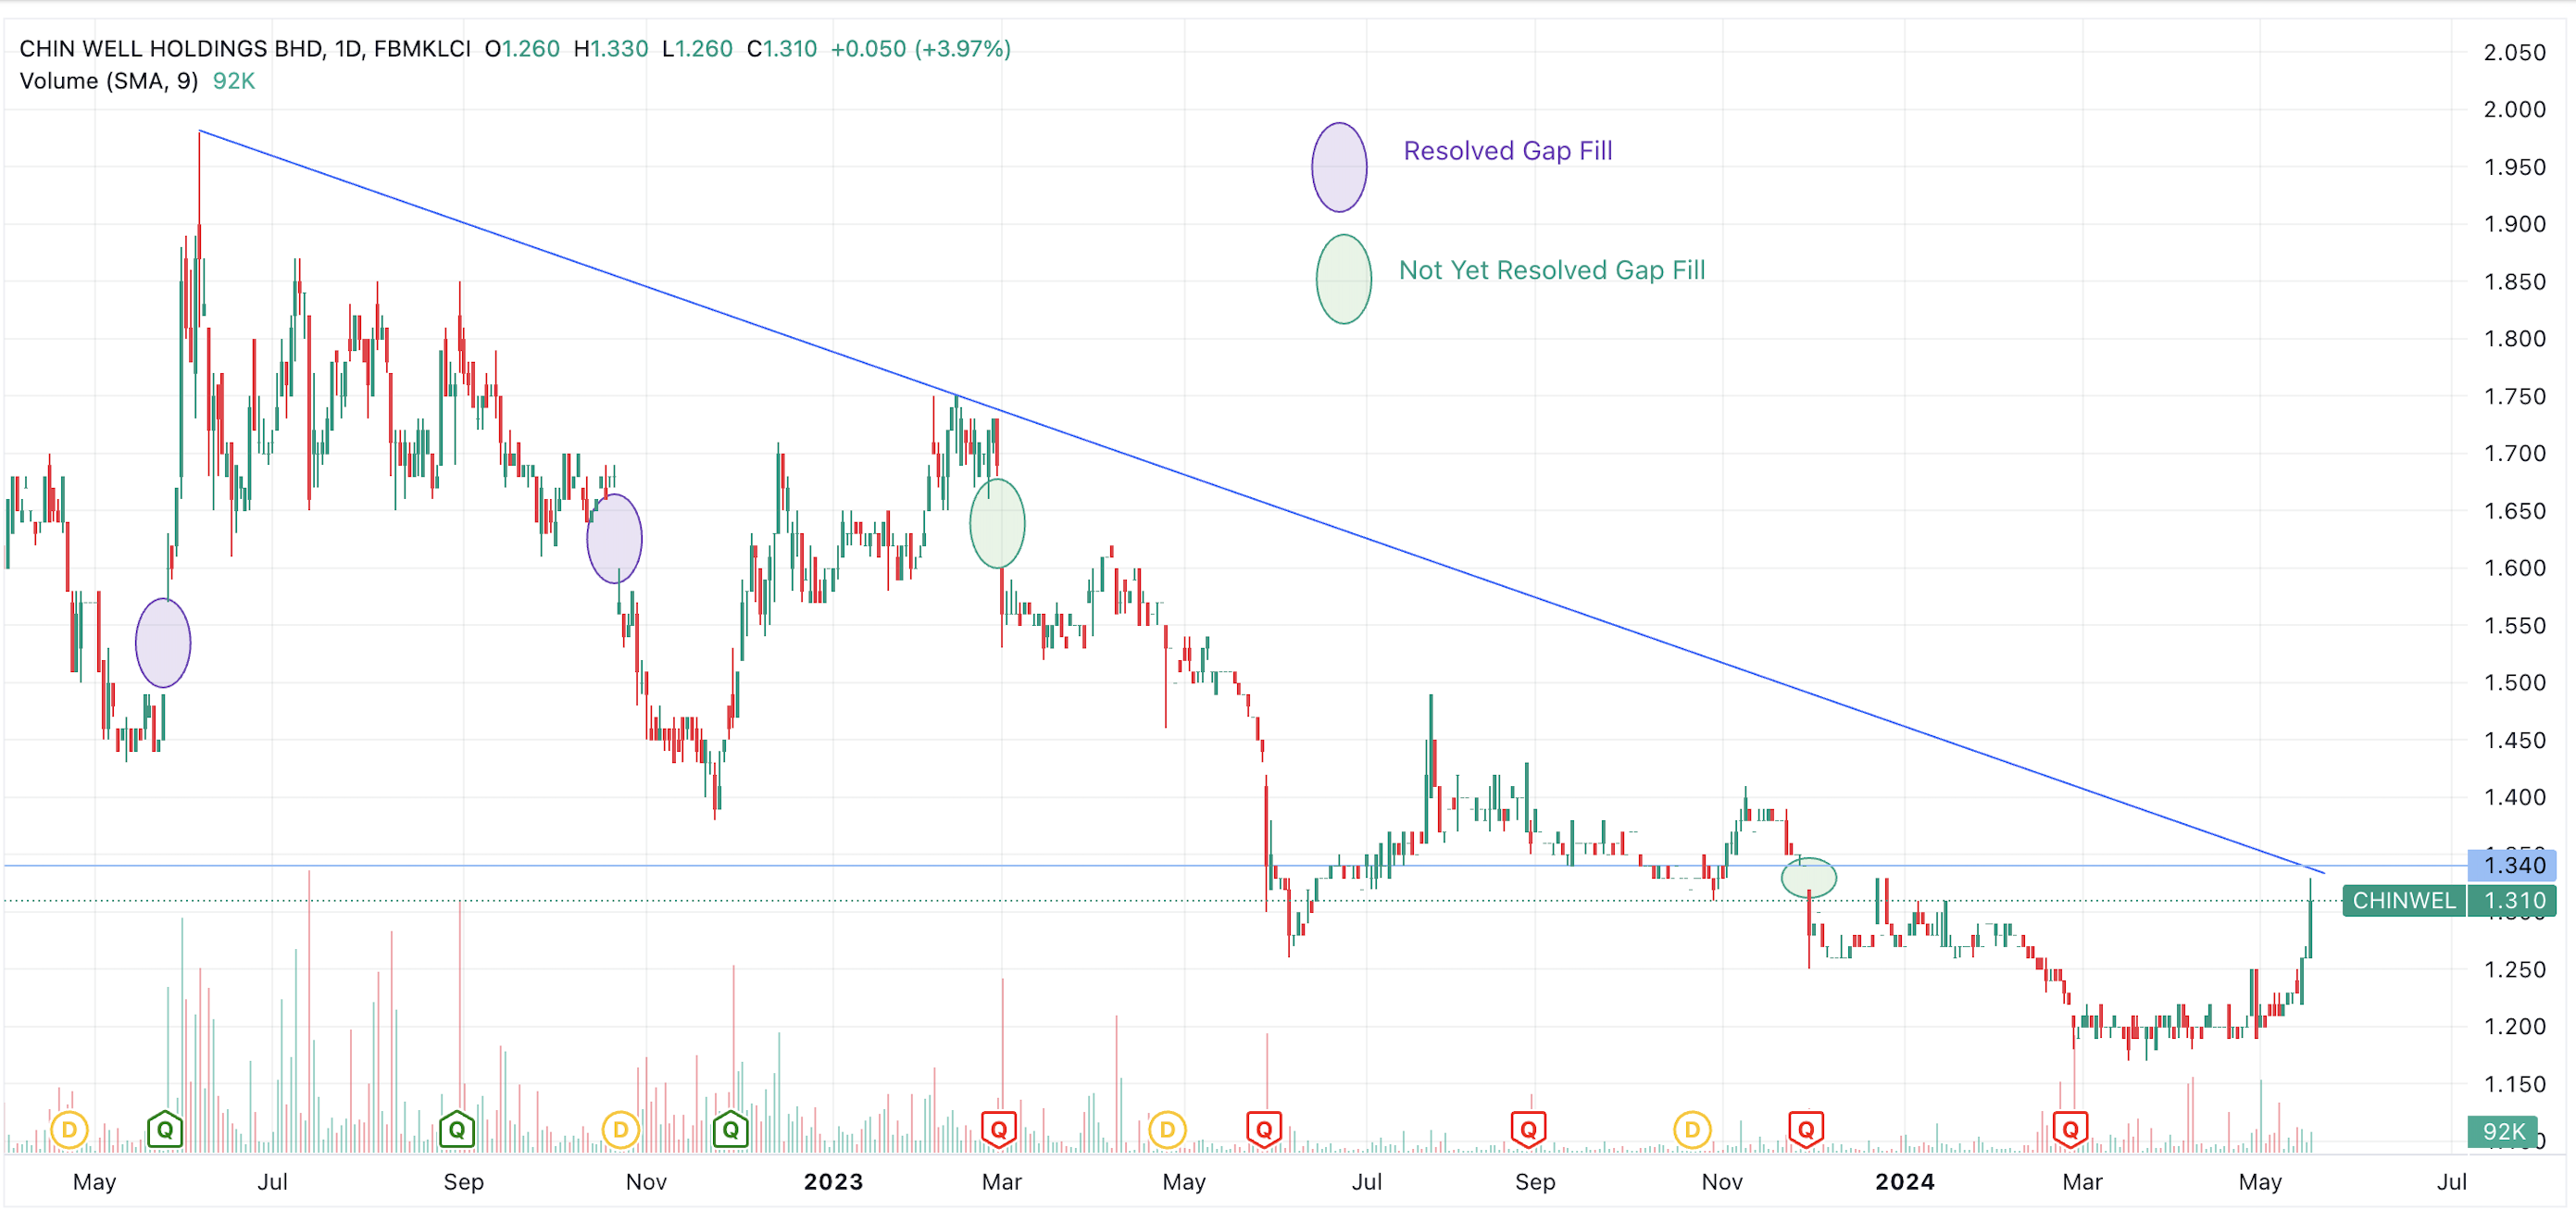
Swing traders using daily charts will notice this resistance at 1.34, which is a confluence of both downtrend line and the small opening gap fill market in green bubble:

Will I sell at 1.34 since there is already a fast win of 13.6% on what accumulation at 1.18?
By now, if you've read my articles and follow my thoughts, I am NOT a swing trader. I don't trade the small zig and zags on my fundamental positions.
Fundamentally:
- CHINWEL runs a sound business.
- Its business is facing headwinds, but if history is a guide, it is likely to be temporary and likely to overcome it one day but one must be patient.
- I would assess its business quality to be above average, ranging from C+ to B-.
- It is flushed with large net cash, around 96 sen. Looking forward, this year's earnings is bad, so, this year's DPS will be lower.
- However, over the next 5-10 years, I expect its DPS to be around 30-60 sen i.e. roughly 6 sen per year, suggesting a long term dividend yield that is higher than FD and matching EPF, assuming zero price gains.
- Additionally, this year, KLCI has been hot, as I blogged earlier here. Most gains comes from sitting than doing.
Which means:
- We should look beyond the first bubble - the 2nd unresolved gap fill is around 1.68, that could be a first target over next 12 months. That's 50 sen gap, or 42.4% returns if reach there over 12 months. Or 19% CAGR over 2 years, or 12.5% CAGR over 3 years.
- But what is realistic over 5 years?
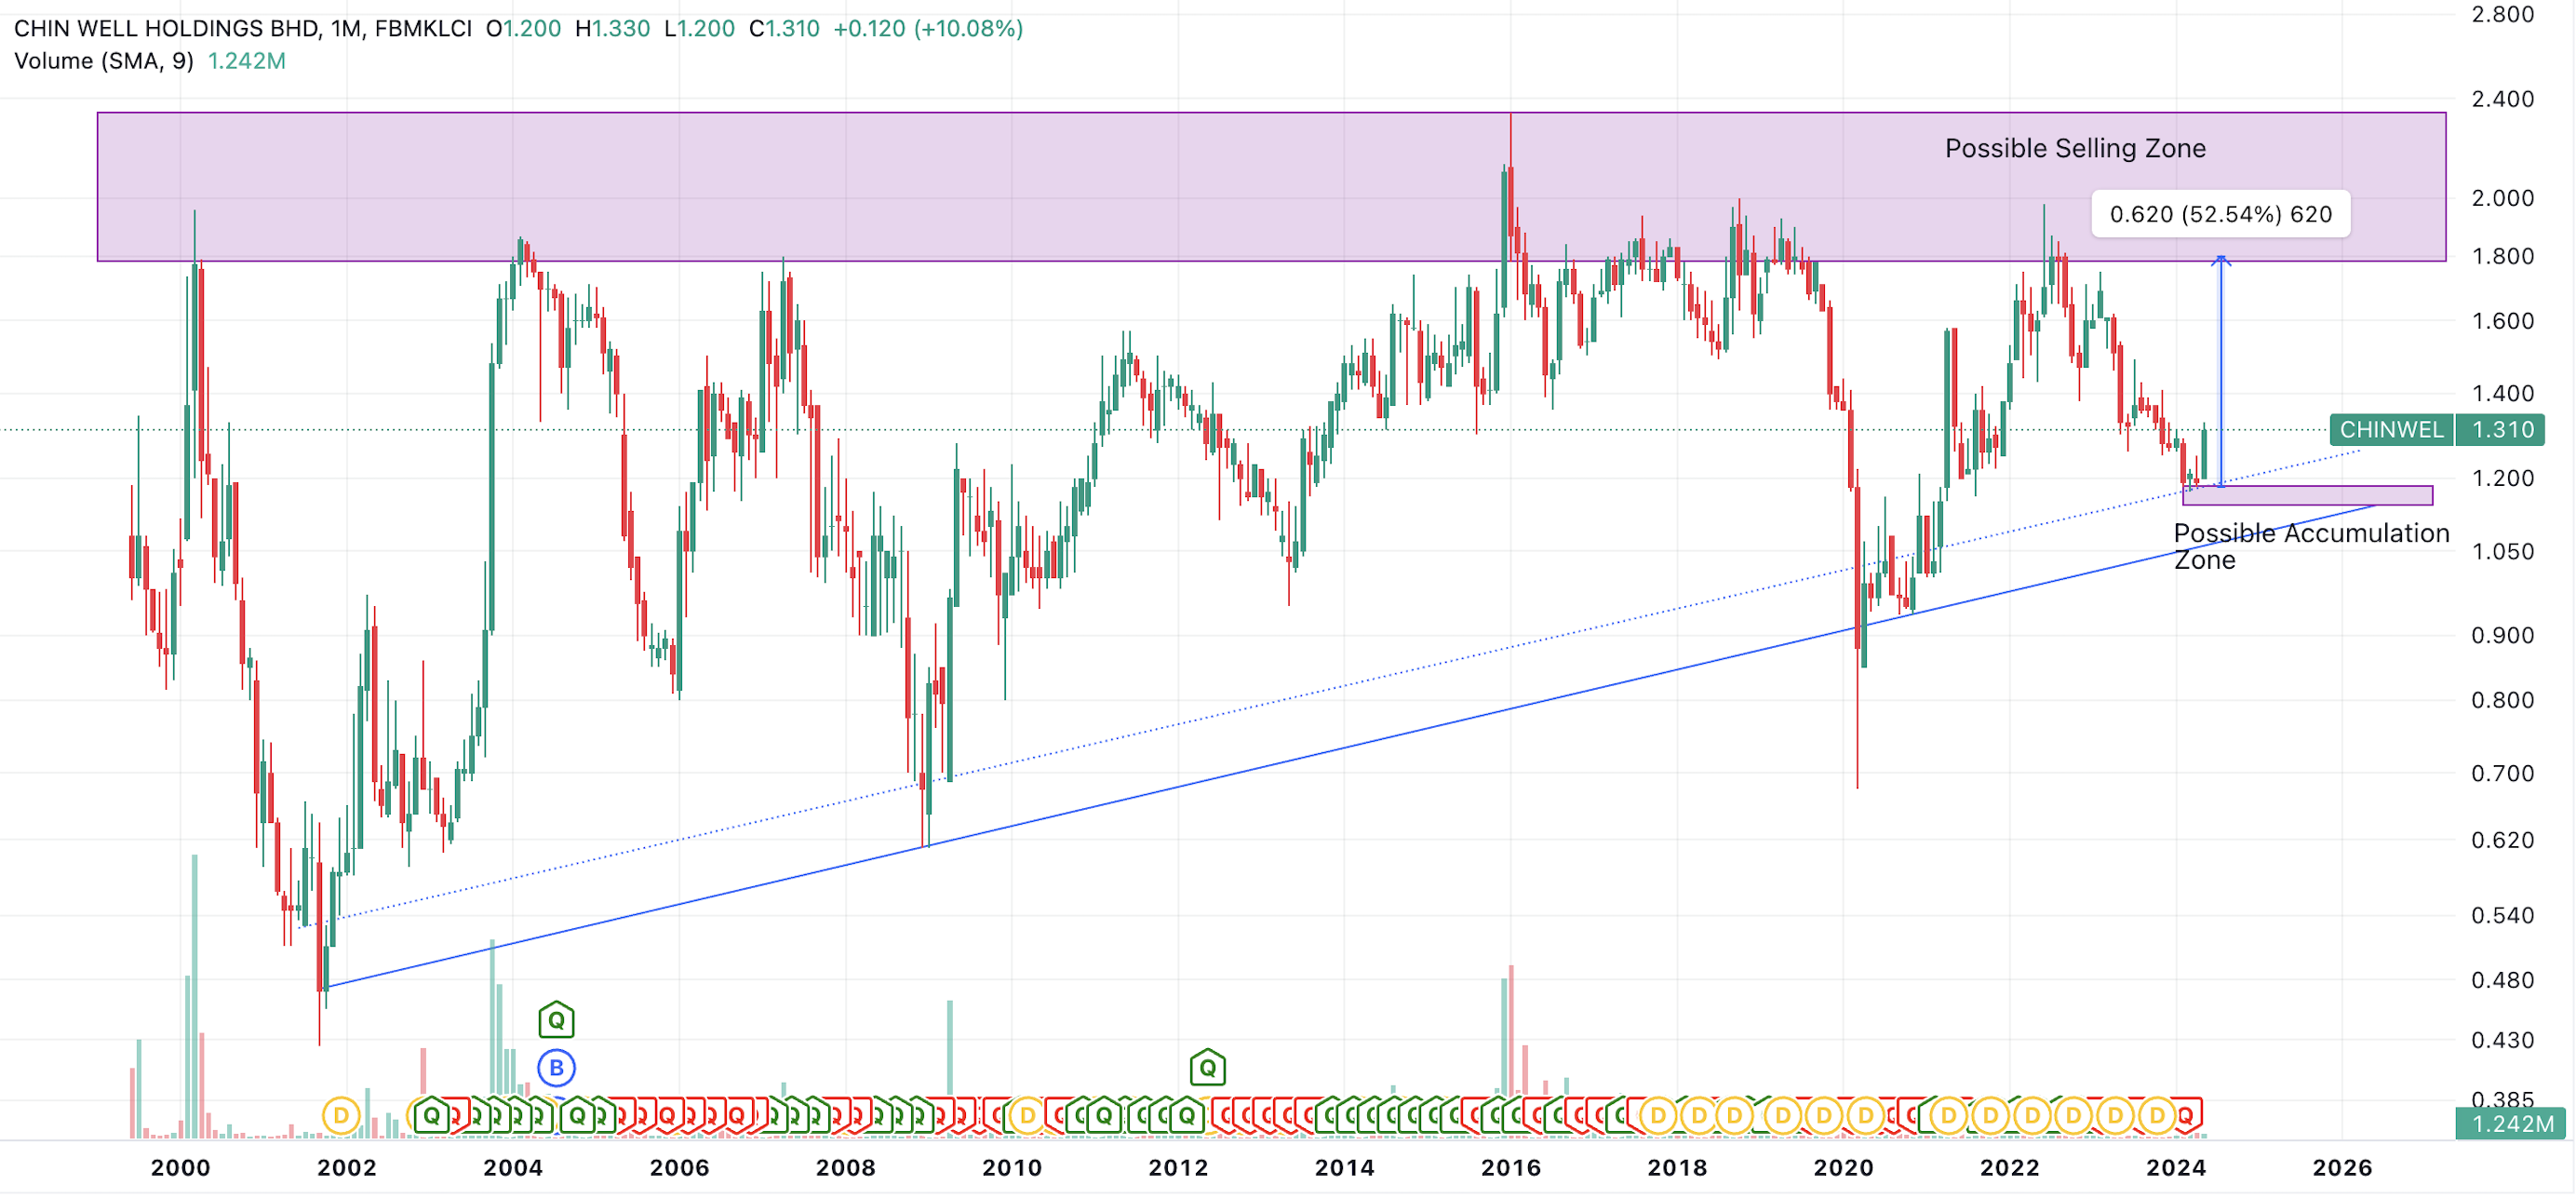
As usual, we tune out to the longer term monthly chart.

We are reminded:
- CHINWEL has a cyclical price action - it likes to bounce between support trend line and horizontal box resistance shown.
- However, there appears to be a rising uptrend line support as shown, i.e. it's a sound business over longer term.
- The horizontal box resistance is a wide box, ranging from say 1.80 to 2.30 or so. Measured from 1.18 to 1.80, there's 62 sen difference i.e. where 1.31 (or 1.34) is too near and could still be accumulation zone for traders who wants more confirmation that the bottom is in.
In short, nothing's changed for me. Just not interested to sell at 1.34.
Investing does not have to be difficult. In future it shouldn't take you longer than a minute to view this.
All the best!
Disclaimer: As usual, you are fully responsible for your own investment decisions.
Related Stocks
| Chart | Stock Name | Last | Change | Volume |
|---|
More articles on https://dividendguy67.blogspot.com
Created by DividendGuy67 | Jan 24, 2025
Created by DividendGuy67 | Jan 22, 2025


