


https://dividendguy67.blogspot.com
ANNJOO - Cyclical Trades

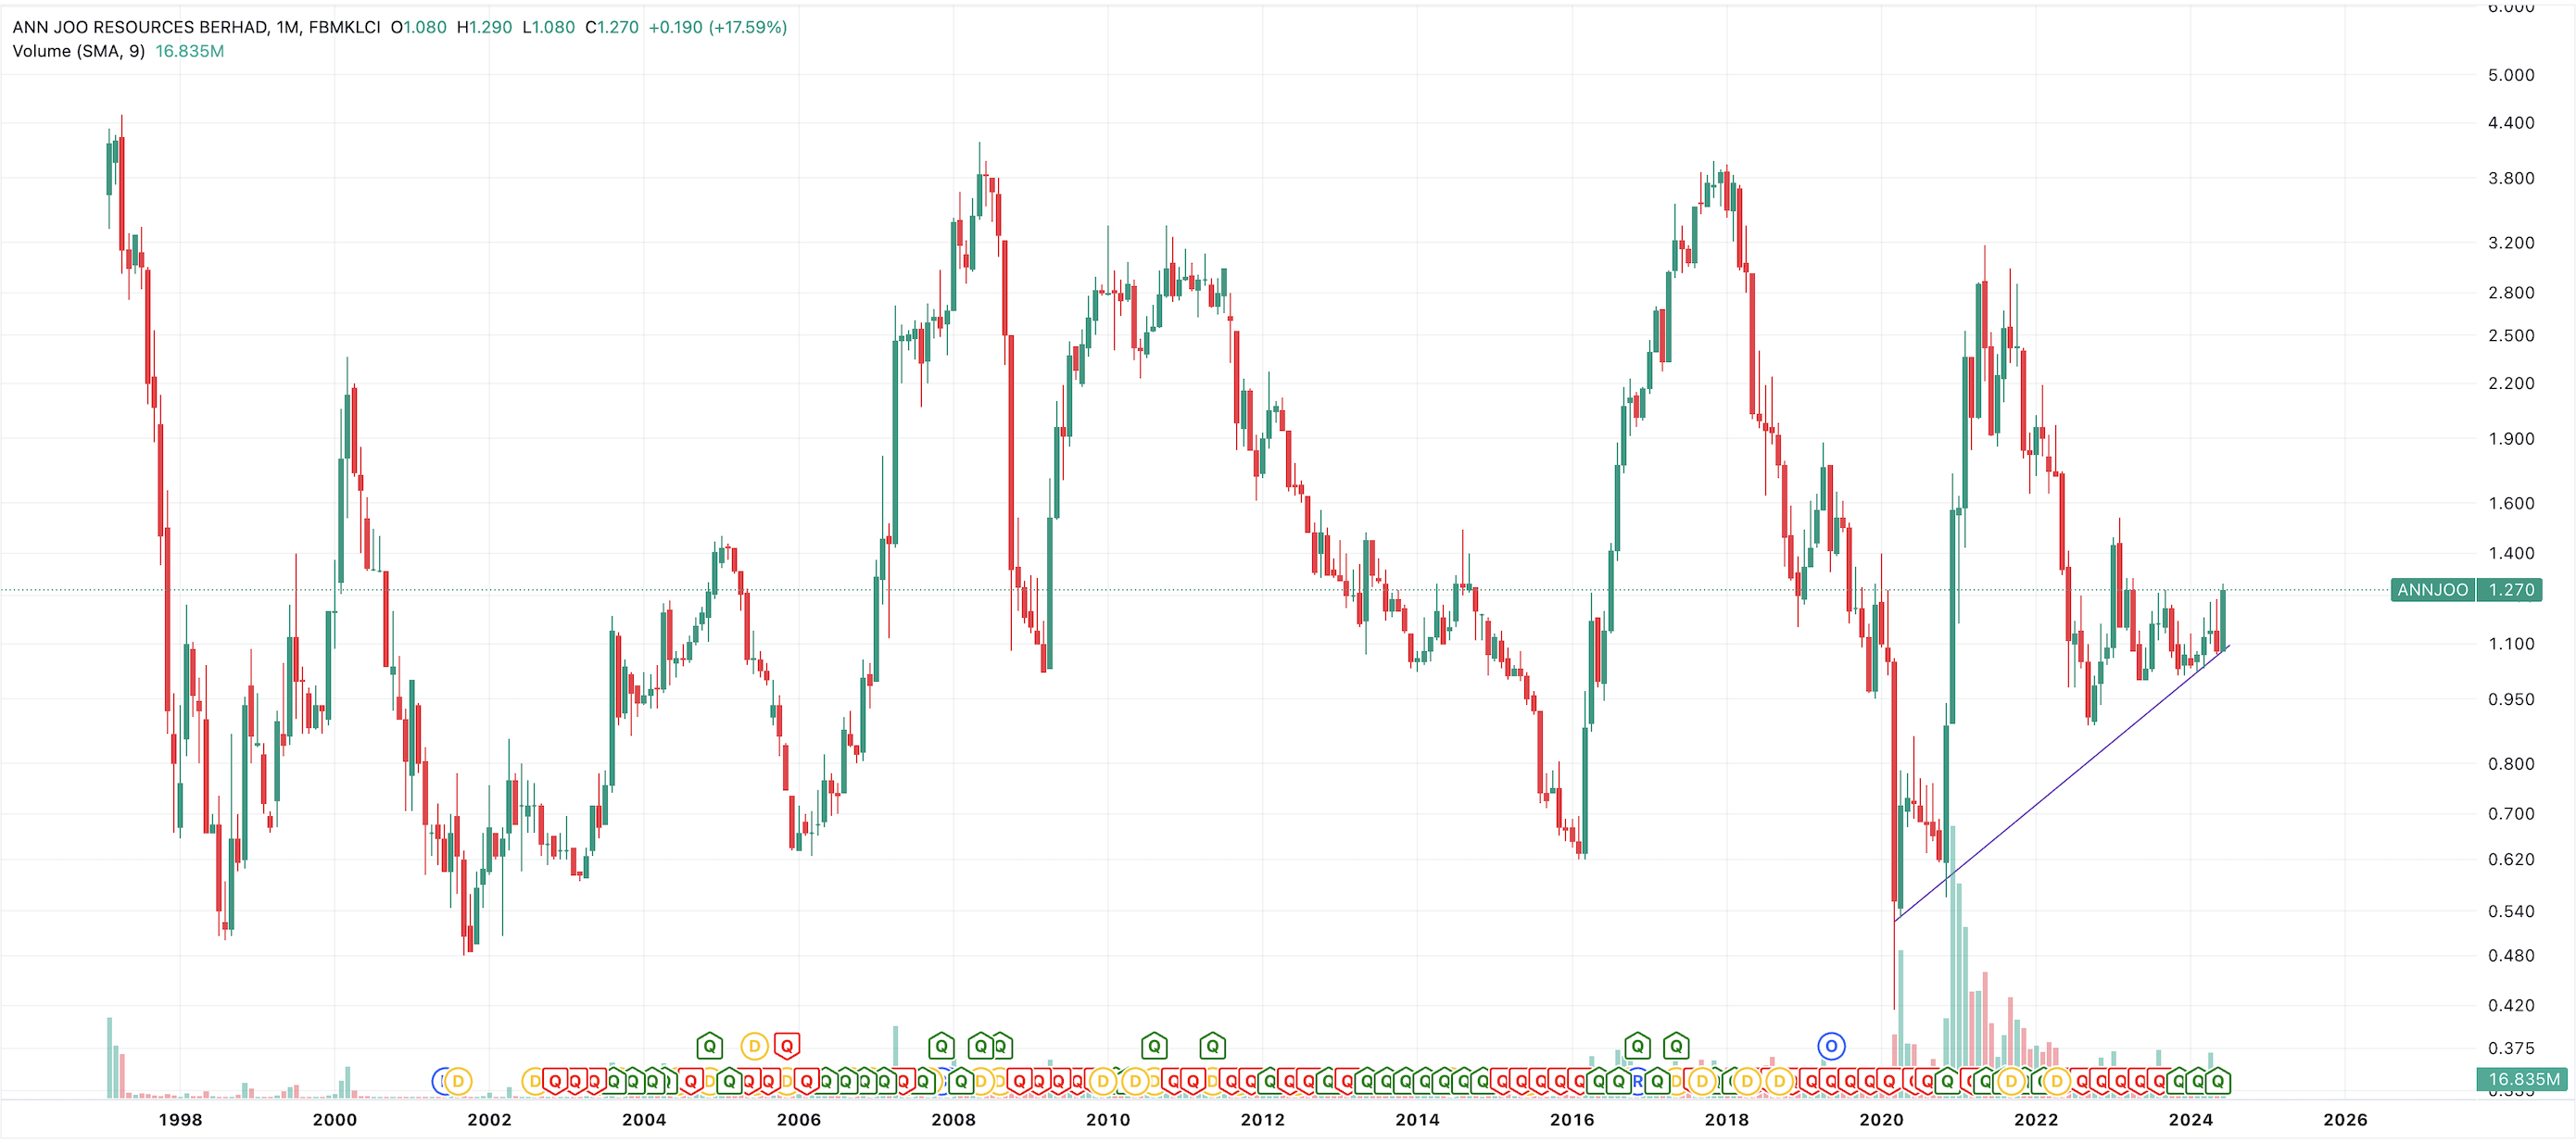
A picture paint a 1000 words - the monthly candle chart gave me the confidence to buy low.
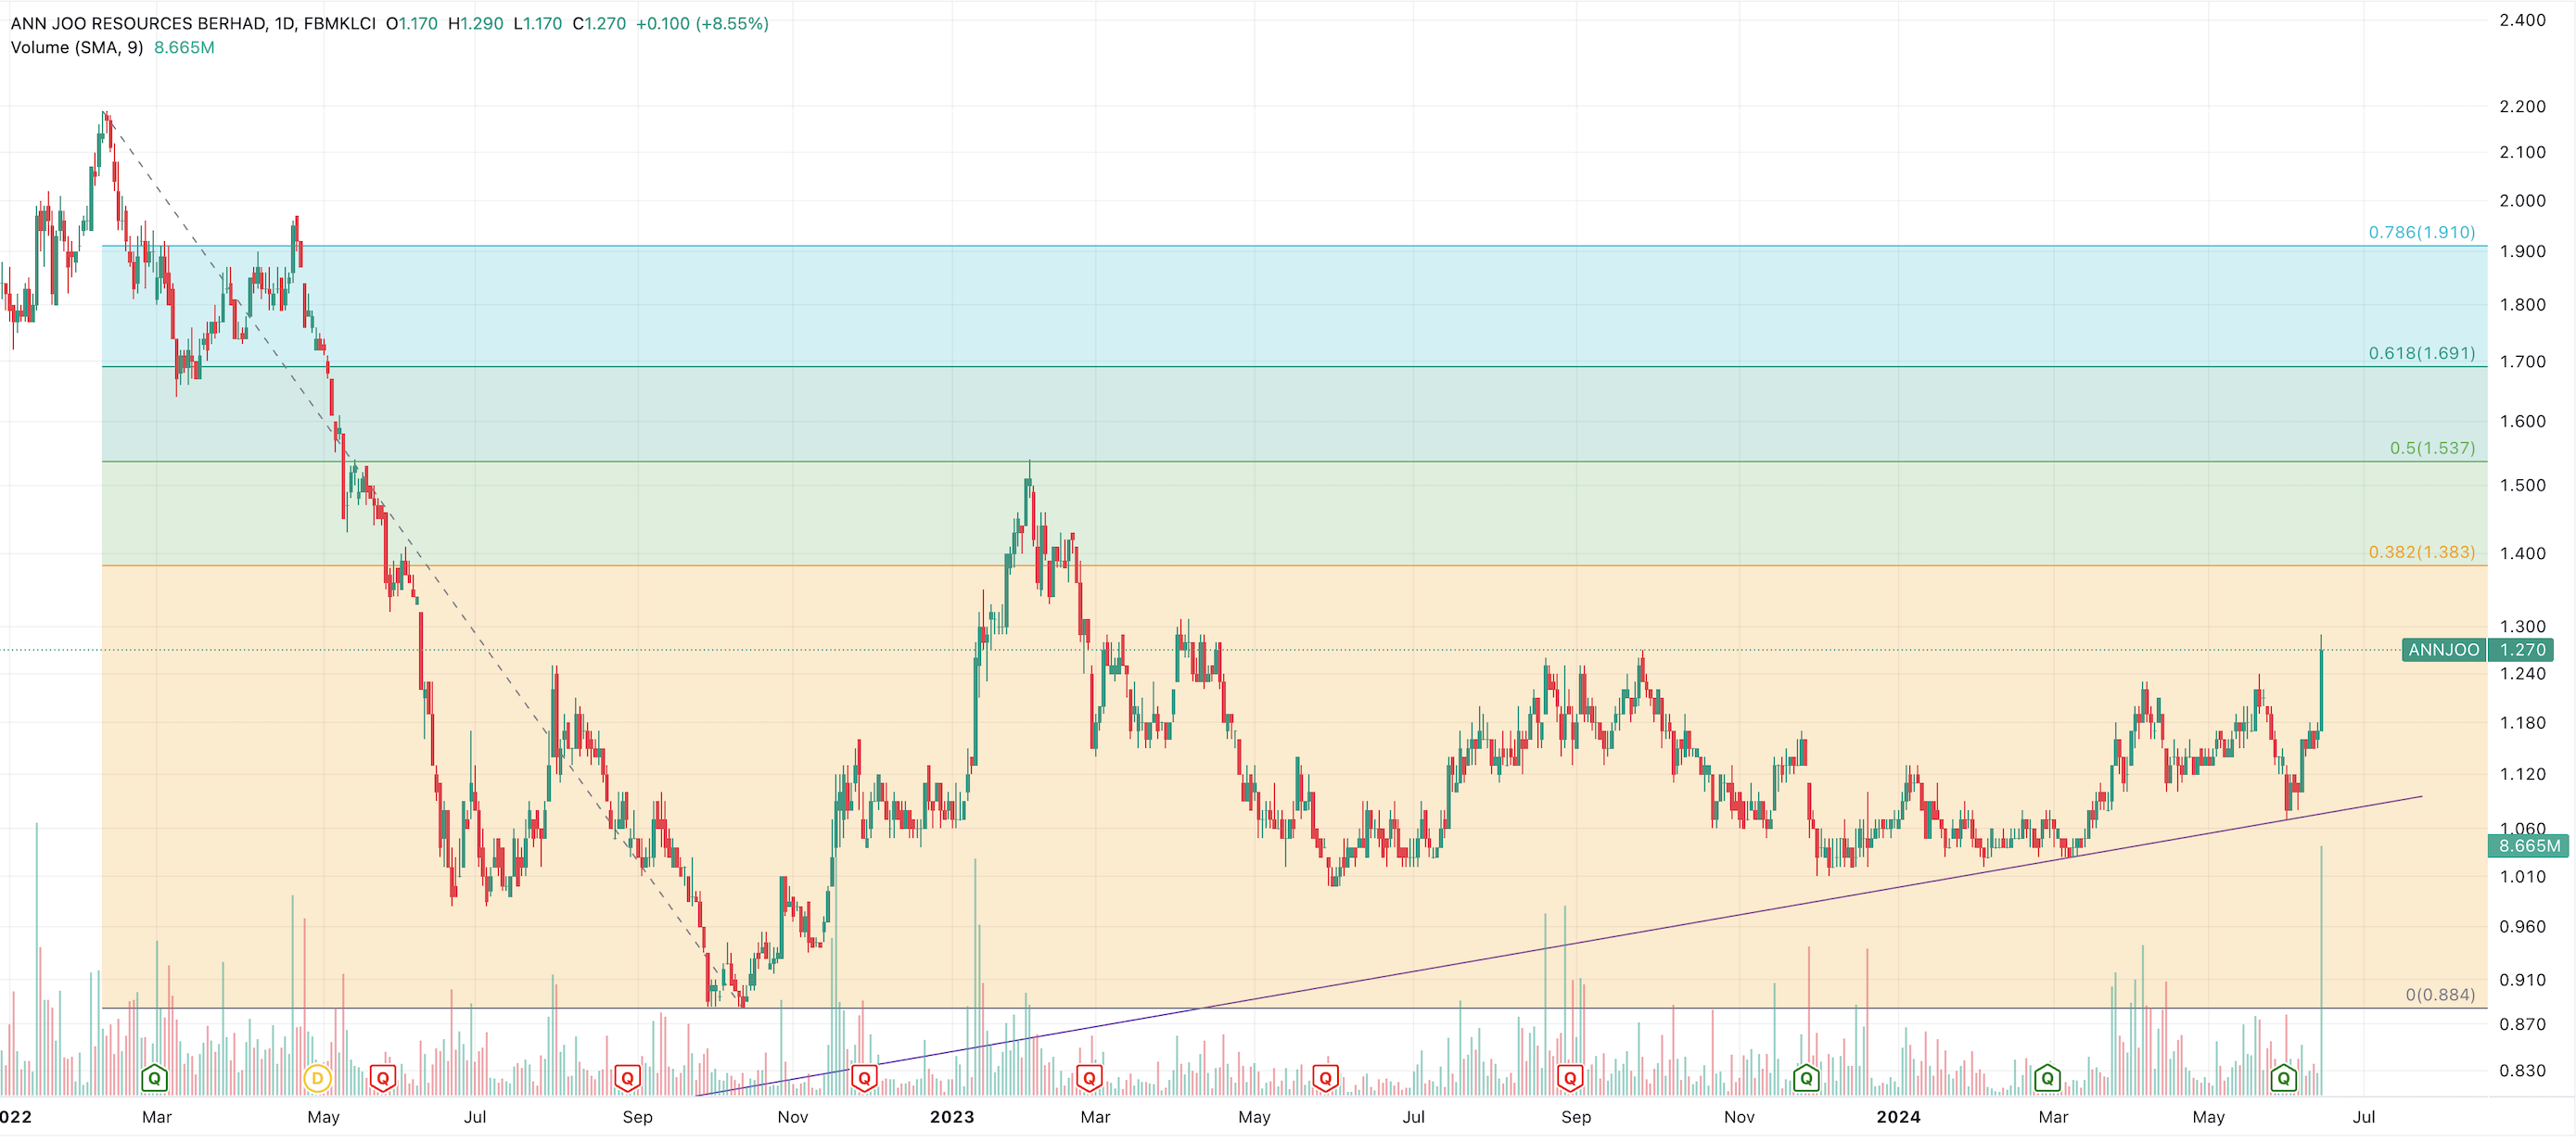
The daily candle chart tells me another high probability sell zones:
I have been trading in and out of this stock (always retaining something in case it does a big big move up) at least 2 different rounds (each round may have several bullets). My records since Sep 2022:
- Round 1 - several buys between 14/9/22-11/10/22 ranging 89 sen to 1.02. Sell Jan 2023 around 1.15 to 1.29.
- Round 2 - several buys between Jun-July 2023 around 1.00 to 1.02. Sell August 1.26.
- Round 3 - several buys in Oct-Nov 2023 around 1.02-1.08. Today super massive volume at 1.27 close.
Due to the rotations, my IRR, net of expenses is 30.8% per annum as of this evening.
However, as it is a trading stock, the position sizes are smaller than investing positions for me.
Disclaimer: As usual, you are fully responsible for your trading and investing decisions.
Related Stocks
| Chart | Stock Name | Last | Change | Volume |
|---|
More articles on https://dividendguy67.blogspot.com
Happy January! Trump inaugurated, account new all time highs
Created by DividendGuy67 | Jan 22, 2025
Discussions
Be the first to like this. Showing 0 of 0 comments
Post a Comment
Featured Posts
Introducing MY's First IPO Fund for Sophisticated Investors!
New Update. Discover investment communities that resonate with your ideas
M & A Value Partners IPO Equity Fund has been launched - Targeted 13% Return p.a
Latest Videos


MQ Trading Signals
Time
Signal
Duration
Type
2025-01-22 16:00:00
EMA 5
10 Mins
SELL
2025-01-22 15:40:00
ADX
10 Mins
SELL
2025-01-22 15:40:00
TURTLE SYSTEM 20
10 Mins
SELL
2025-01-22 15:30:00
EMA 5
30 Mins
SELL
2025-01-22 15:20:00
EMA 5
10 Mins
BUY
Apps


Top Articles
1
Mercury Securities Research
2
HLBank Research Highlights
3
PublicInvest Research
4
5
黄金十年-延续篇
6
RHB Investment Research Reports
7
MQ Market Updates
8
RHB Investment Research Reports
Market Strategy - Data Centre-Artificial Intelligence Party Pooper
#
Stock
Score
Daily Stocks
Stock Name
Last
Change
Volume
Stock Name
Last
Change
Volume
Stock Name
Last
Change
Volume
Featured Advertisers / Partners


Ride The Bull Short The Bear
CS Tan
4.9 / 5.0
This book is the result of the author's many years of experience and observation throughout his 26 years in the stockbroking industry. It was written for general public to learn to invest based on facts and not on fantasies or hearsay....