


https://dividendguy67.blogspot.com
GENM - Entering Accumulation Zone

Previously, I posted here that I will wait at RM2.50 to accumulate GENM. At the time, GENM has made an earlier peak near RM2.94 and RM2.83 and falling down towards my expected target.
It's been nearly 4 weeks now and still haven't reached RM2.50! My GTC Limit Buy order is about to expire! (as a position trader, this is normal to stalk for weeks, months sometimes, even years).
During this period, some commentators are worried about buying GENM, for fear of loss. Let me illustrate the concern.
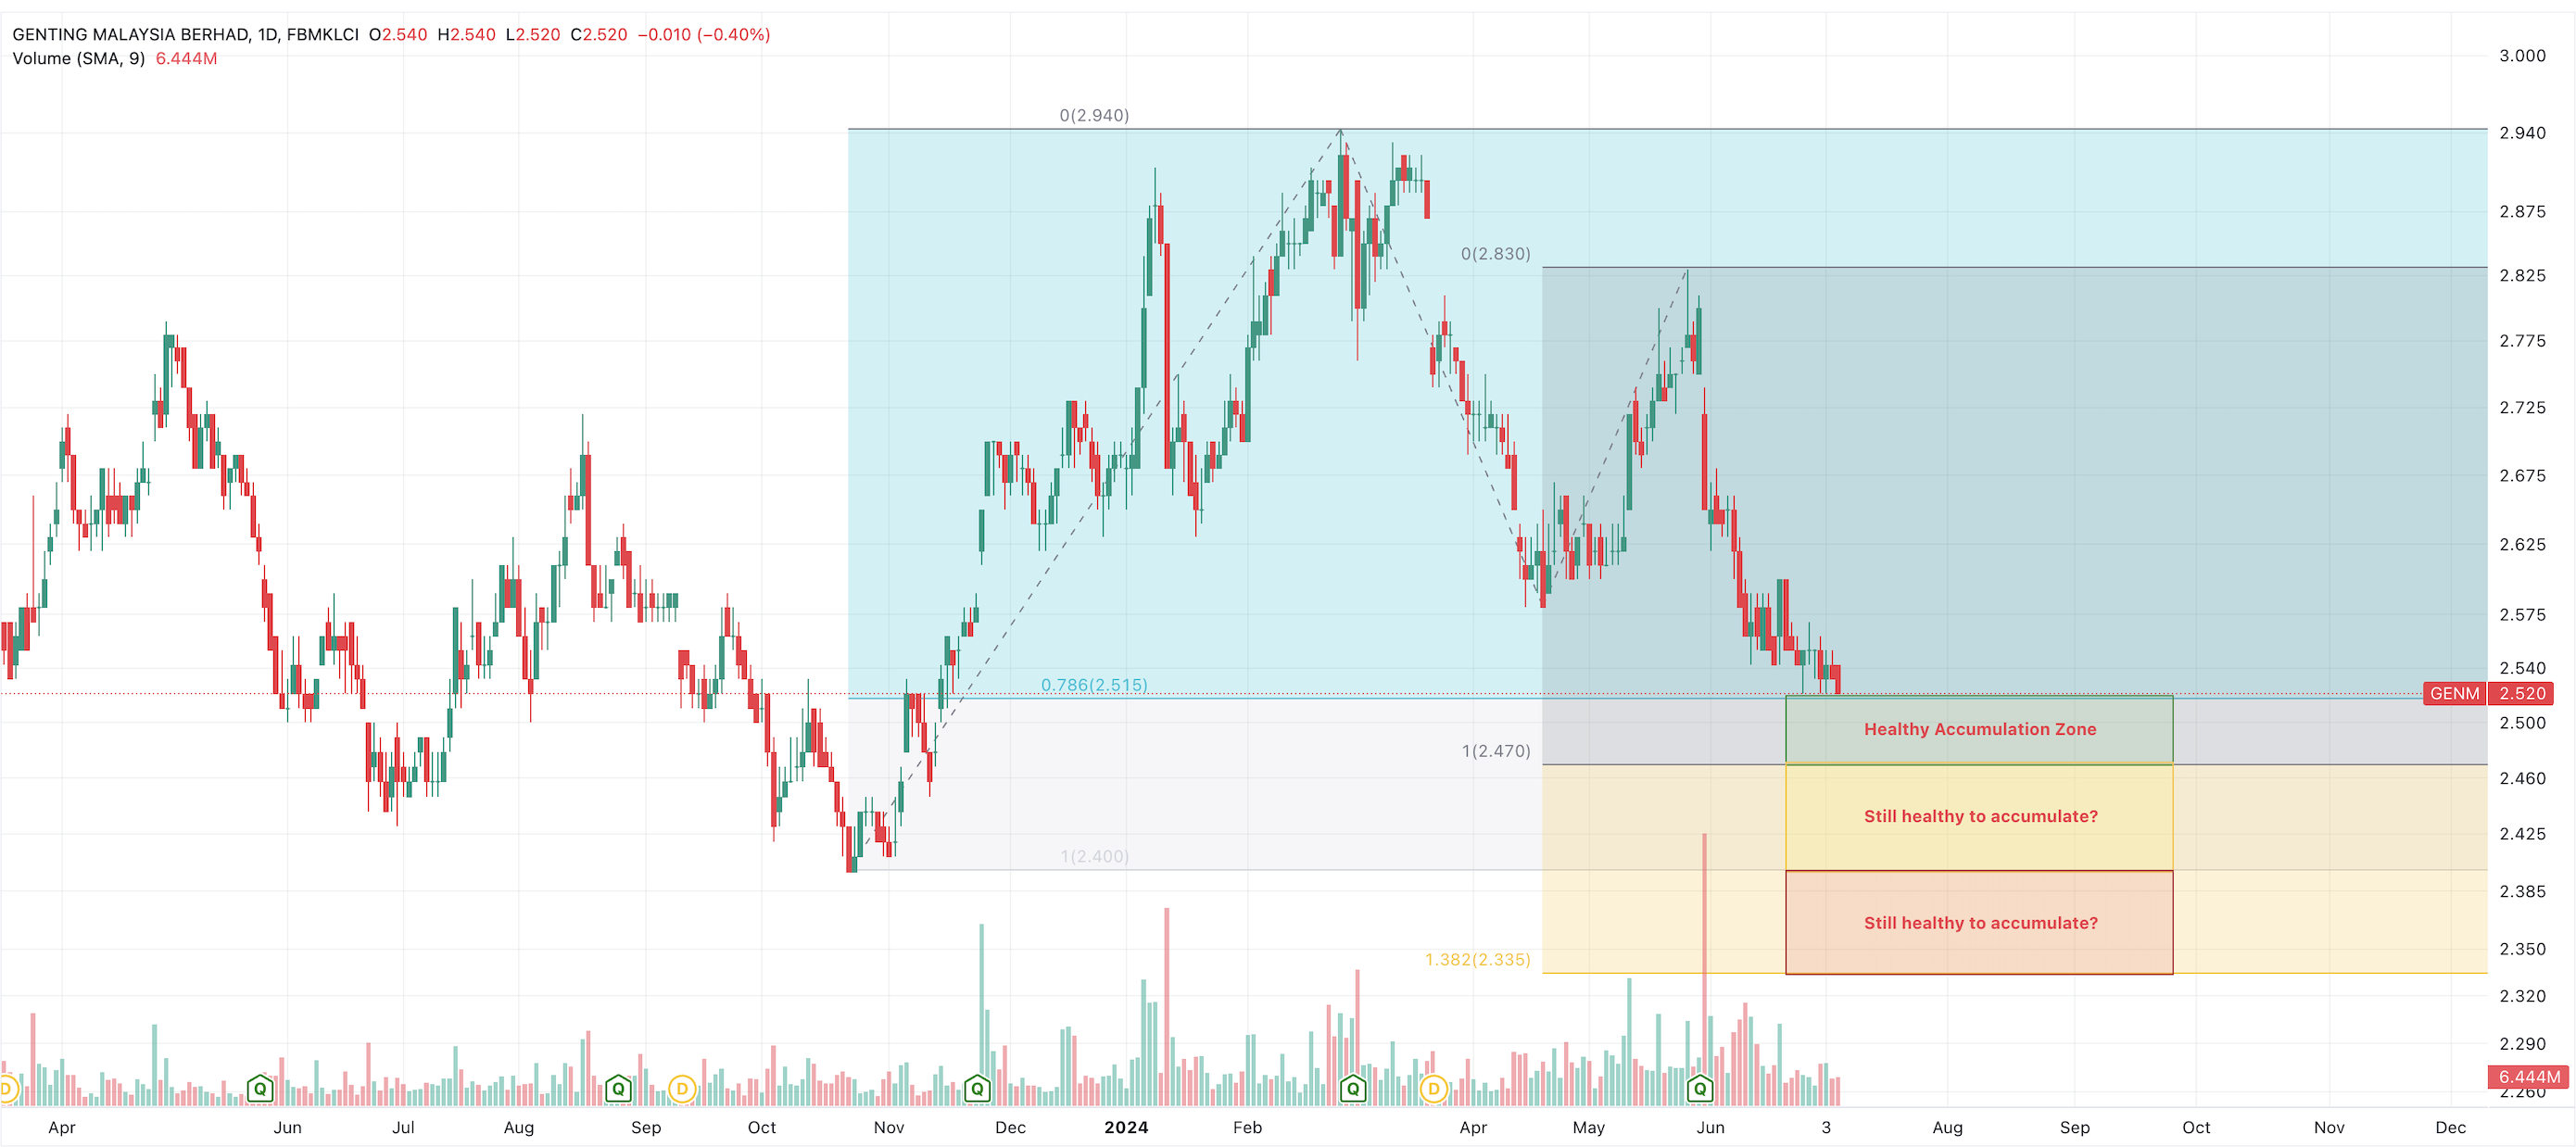
Let's look at the Daily chart below. I draw 3 boxes, with different Accumulation Zones:
Zone 1 (2.47 to 2.515) - my gut says this is normally a healthy accumulation zone in that if price doesn't go below this, it prints a higher low and so is a healthy one.
Zone 2 (2.40 bottom) - sometimes, one becomes less sure if this is healthy because the reasoning goes like this - "Earlier, GENM printed a higher high at 2.94 and 2.83, so, why after printing a higher high, it would then go back to the bottom of the chart of 2.40? Could the reason be due to some yet to be announced internal negative developments, but smart monies already know the reason and selling?"
Zone 3 (2.335 bottom) - The reasoning goes - "Things must be bad - it printed higher high of 2.94, and now it is crashing below 2.40!"
The bears then go up 1 screen higher and show the Weekly Chart, to illustrate their points on the downtrending Channel.
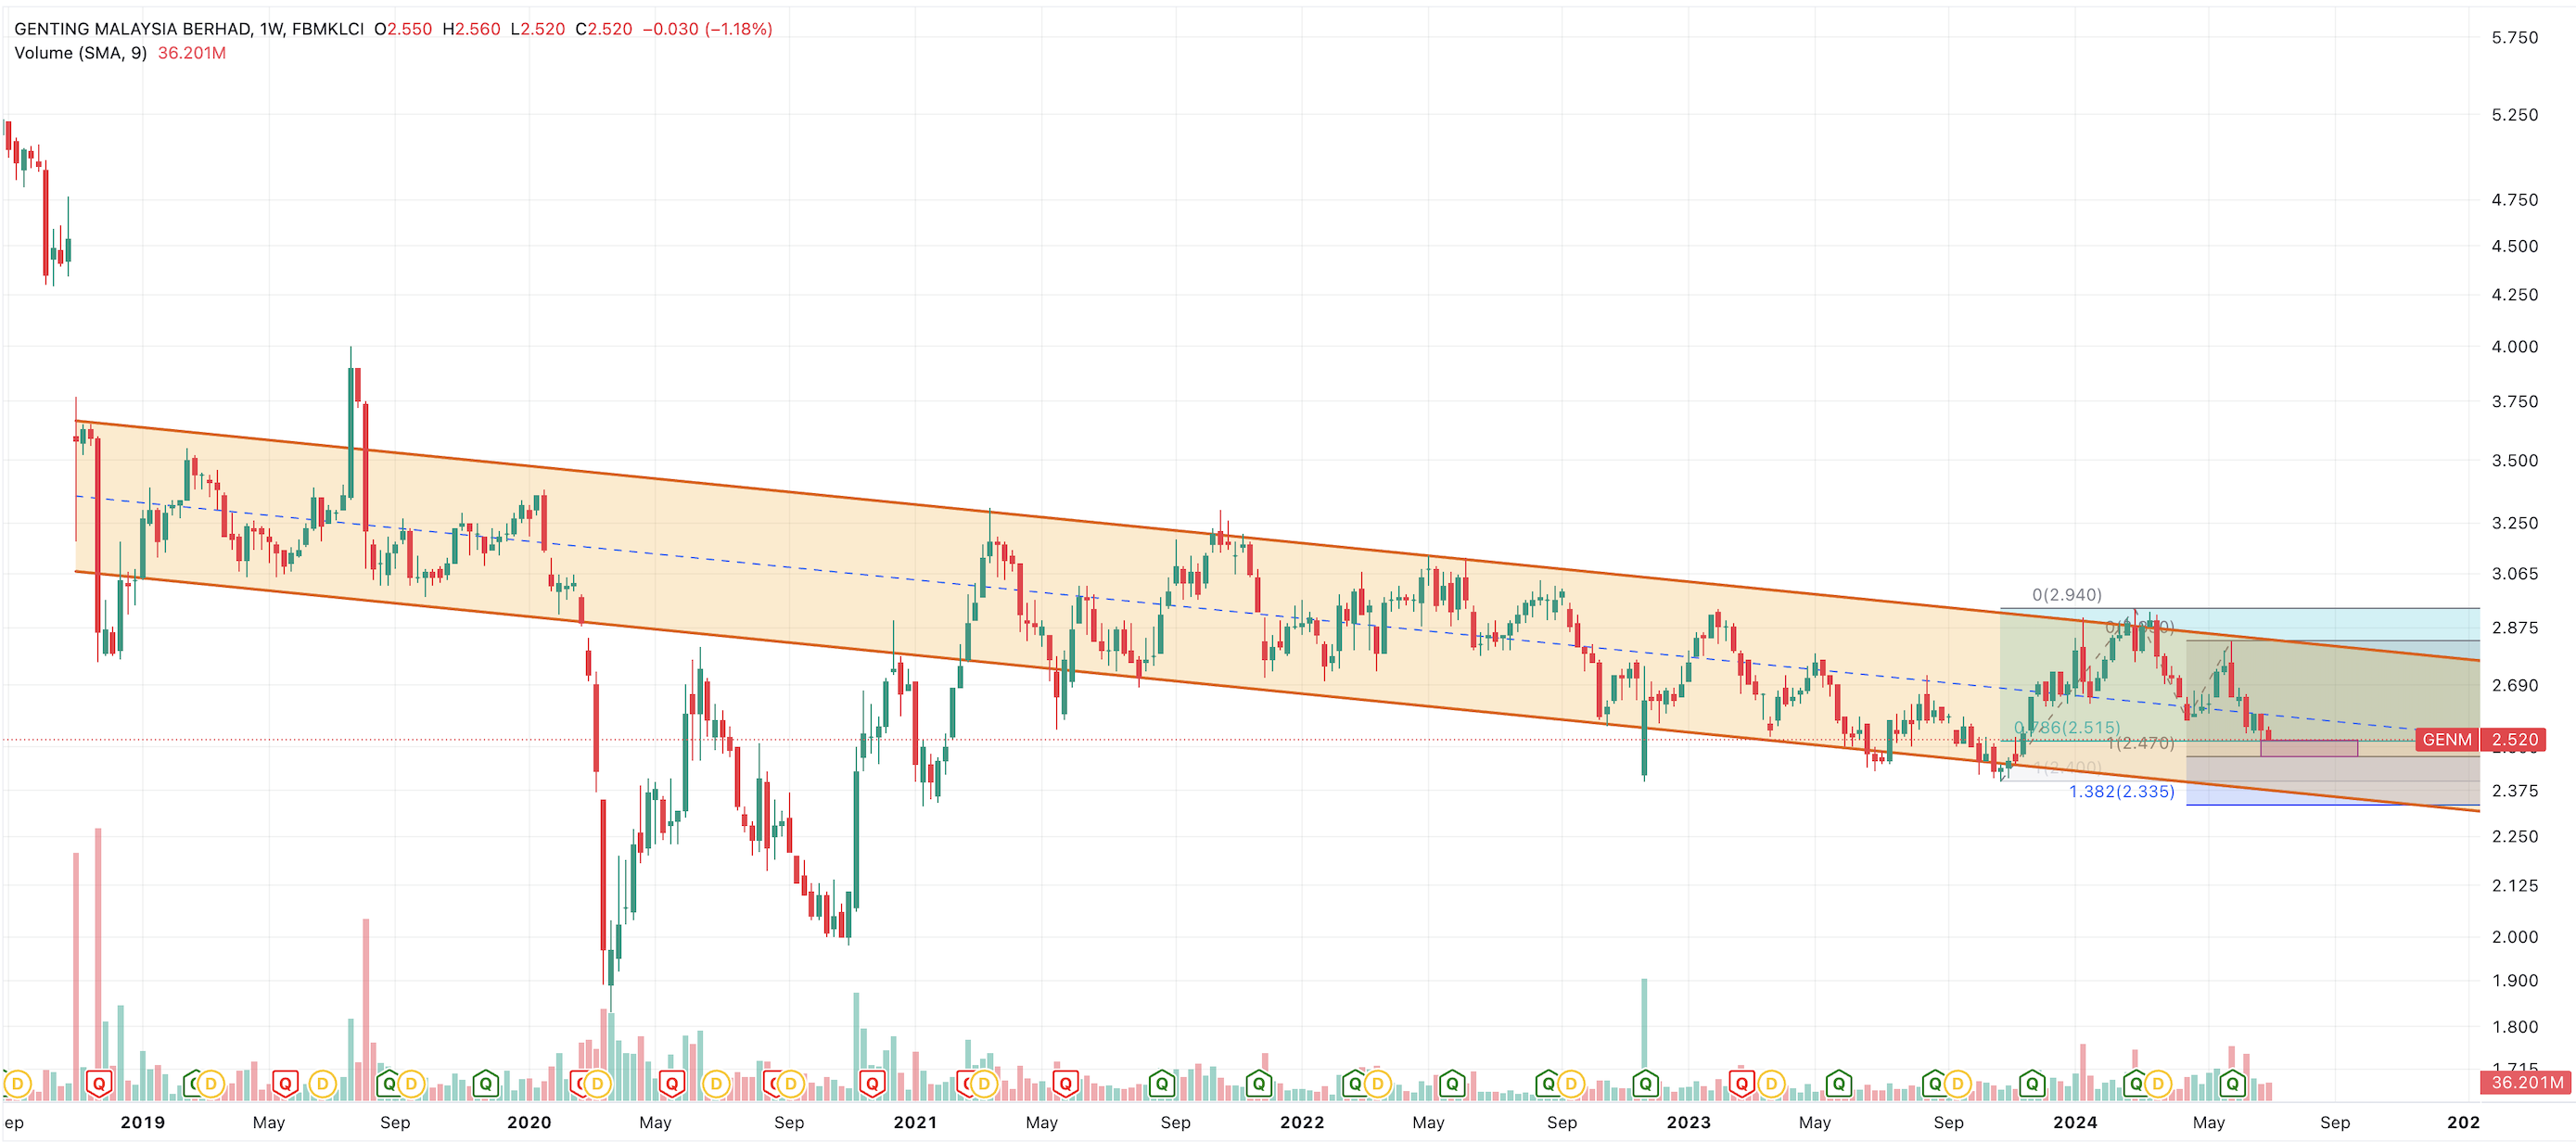
Your perspective becomes richer, isn't it? What additional insight did you see?
Some see bearish trend, I see another new idea - why not wait at the bottom of the channel? That would be Zone 3 isn't it? Suddenly, the Question mark about the safety of Zone 3 is not too terrifying anymore because there is the support from that downtrend channel. The gap is still sizeable between the bottom of the channel to the top of the channel. A swing trader with a time-frame of several weeks to several months might take this trade, to trade the bottom of the "swing" and holding it till it goes near the top of the "swing".
However, I'm not planning to swing trade GENM - that's because there are much better stocks out there for swing trading than GENM. I prefer a longer time-frame for GENM which is Position Trading. (I do supplement with partial swing trading, to squeeze more returns out of GENM position trades).
So, for me, the dominating chart is the Monthly Chart.
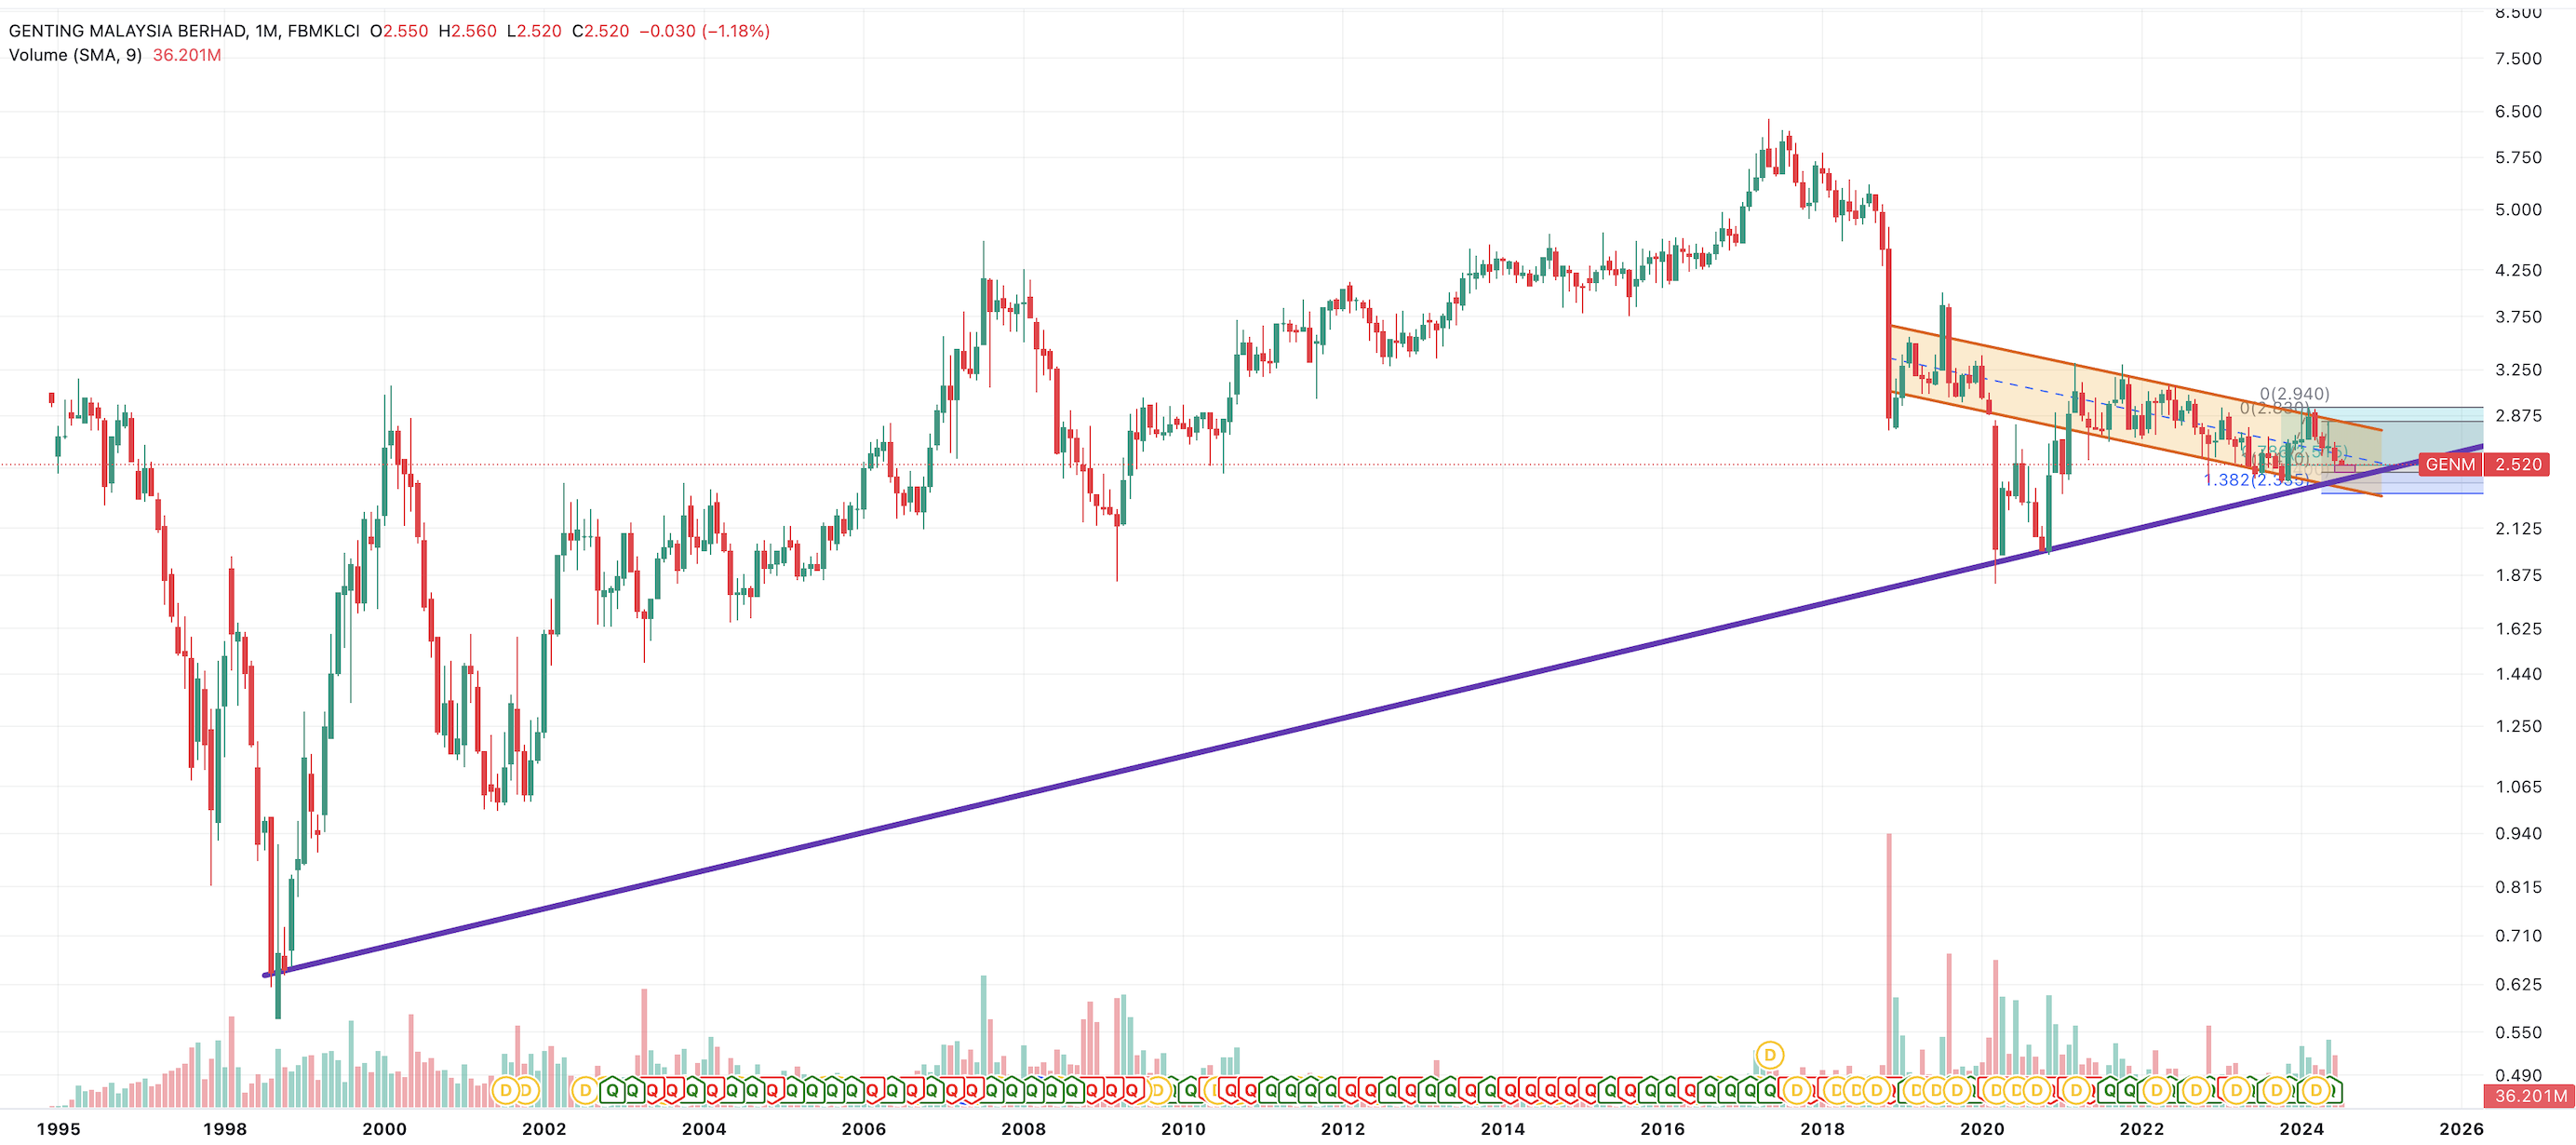
What do you see now?
I see that massive uptrend line support that goes back since 1998, connected with Covid lows and it's now pointing towards a price that makes the Accumulation Zones quite positive for a trade.
Potential Reward?
Looking at the Monthly chart, *if* the thick purple support line hold, and price goes up, you have a long term "double bottom" opportunity. Even if you say there's a 50% chance that this Double Bottom doesn't work, there is still a 50% chance that it might work. And if it does work, it may take years but this stock will likely shoot up past 50% retracement at a minimum, suggesting nearly RM4. The returns from RM2.5 to RM4 is nearly 60% and if it takes 6 years to get there, that's additional 10% per annum, on top of dividend yield of 6% per annum i.e. this is a chance where it makes sense to have a position. The downside I feel is much smaller than the potential upside by several times.
How often does this opportunity comes?
It took 7 years for GENM to fall from the 2017 peak to reach the current zone. Price was temporarily below 2.40 during Covid pandemic nearly 3+ years ago. So, it's not very rare, but is rare enough for the position trader to start positioning. True, the accumulation zone is a wide one, that's very normal for a chart like this, but over multi-years, this is very normal.
Fundamental catalysts?
Personally not important to me to know. I trust there will be one announced in future when the time comes, based on its price action. To me, I would be highly surprised, if later in the next 2 years, there isn't one to propel this stock up, after hitting support zones - it could print a double bottom that spans up to 12 months, hence, no rush for me.
Position Sizing
I think its desirable to position size for this opportunity is neutral to slightly larger than neutral. In a 40 stock investing portfolio, neutral would be 2.5% capital. My guess of an A-rated position size is somewhere between 2.5%-2.9% capital. (the rating is subjective, depends on the relative attractiveness of this trade vs other positions). By definition, if you find a trade like this where it is near the multi-decade up trend line, and the rest of your portfolio is moving along is path, then, this trade may be slightly more attractive if all else is equal (and all else is never equal). Currently slightly below 2%.
Risk Management
My risk control is Position sizing - not more than 2.5%-2.9% of capital. For position trading, there is no stop loss - it's not needed, my maximum loss will be tiny as long as I don't violate the risk control from this position size limit. If it's clear after several months/years that this is a dud, then, I just leave it there to collect dividends and when I find a better idea and need the cash, then I just rotate this stock into a better position.
Trade Strategy
I would aim to be positioned up to 2.4% capital in Zone 1, 2.7% capital in Zone 2, 2.9% capital in Zone 3.
If it doesn't hit Zone 2, at least I have 2.4% positioned. If it doesn't hit Zone 3, I should have 2.7% positioned.
Buy and forget (because it will take months/years to hit the RM4 target)
My Position Trade Goals
To beat a modest objective of 9% per annum over multi-year (> 5) period.
Assuming price gains of 3% per annum, I think the odds are very high, that we'll meet that (since RM4 in a few years exceed RM3.40 after 10 years).
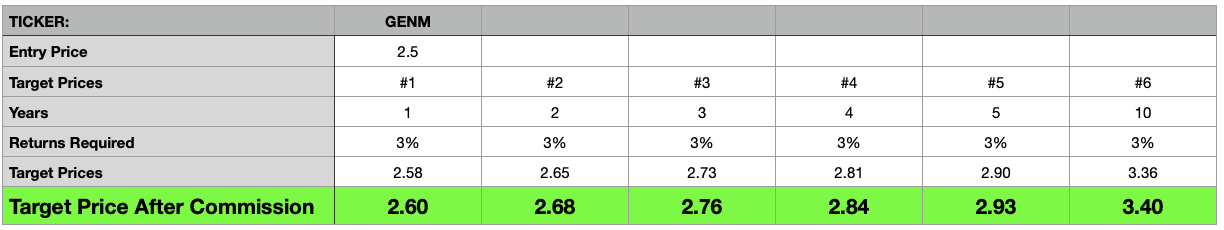
If it takes 10 years to reach RM4, this gives 4.7% CAGR price gain, i.e. a total return of 10.7% CAGR.
If it takes 5 years to reach RM4, this gives 9.6% CAGR price gain, i.e. a total return of 15.6% CAGR.
This suggests a very high probability of achieving my modest goal for this portfolio. I am content for 2%-2.9% of my portfolio long term.
Disclaimer: As usual, you are fully responsible for your own trading and investing positions.
Related Stocks
| Chart | Stock Name | Last | Change | Volume |
|---|
More articles on https://dividendguy67.blogspot.com
Featured Posts


Latest Videos


MQ Trading Signals
Time
Signal
Duration
Type
2025-01-17 16:30:00
ADX
5 Mins
BUY
2025-01-17 15:50:00
VOLUME BREAKOUT
5 Mins
BUY
2025-01-17 15:50:00
TURTLE SYSTEM 20
5 Mins
BUY
2025-01-17 15:50:00
TURTLE SYSTEM 55
5 Mins
BUY
2025-01-17 15:40:00
EMA 5
5 Mins
BUY
Apps


Top Articles
1
RHB Investment Research Reports
2
Dragon Leong blog
3
Haha and Hehe
4
5
TA Sector Research
6
RHB Investment Research Reports
7
8
MQ Market Updates
#
Stock
Score
Daily Stocks
Stock Name
Last
Change
Volume
Stock Name
Last
Change
Volume
Stock Name
Last
Change
Volume
Featured Advertisers / Partners


Ride The Bull Short The Bear
CS Tan
4.9 / 5.0
This book is the result of the author's many years of experience and observation throughout his 26 years in the stockbroking industry. It was written for general public to learn to invest based on facts and not on fantasies or hearsay....
crazypapapoor
PAS take over straight worthless
2024-07-07 14:38