


KLSE Stocks Review
Esceram 0100

ChartStory72
Publish date: Mon, 05 Apr 2021, 02:35 PM
ChartStory72
0 211
We post FREE chart reviews on KLSE daily Top Gainers and Most Actively Traded Counters. We are also giving out free reviews for our subs as well. Come join us on Telegram and PM us to learn more and request for the stocks you need reviewing for FREE.
Facebook : https://www.facebook.com/thechartstory
Telegram : https://t.me/thechartstory
Facebook : https://www.facebook.com/thechartstory
Telegram : https://t.me/thechartstory
Another Stock that is requested by one of our subscribers and i am here to fulfil the FREE chart analysis promise.
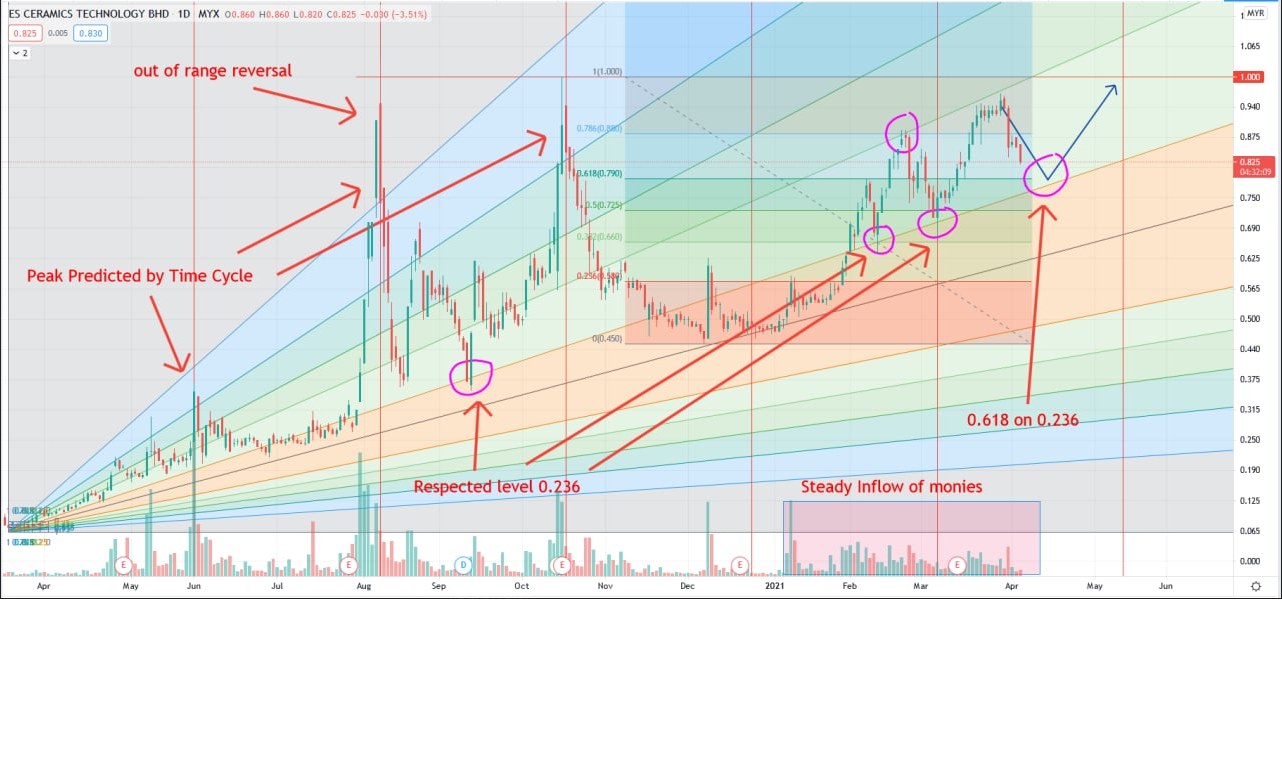
Overall steady uptrend, notice during Aug 2020 prices rose too quickly it went out of 'range' and it quickly reverse back into the Fibb levels or 'range'. At the same time the peak was also accurately predicted by the Time Cycles. By combining both Fibb Trend levels + Time Cycles we can accurately predict the peak of stocks.
Meanwhile, prices are also respecting the 0.236 Fibb Trend level. As prices rebounded off that level for more than 3 times. For the past 3 months, i also see steady inflow of monies which causes prices to rise steadily.
For now prices are retracing and i am expecting prices to retrace towards the 0.236 on the 0.618 Fibb level before heading higher to the next Time Zone. I call this the Duo Fibb Reversal and it is shown with the blue line in the chart.
Industry : Industrial Products
In this fast-moving digital world, we get information in a few clicks.
However, we rarely get first-hand information and more often we get misleading news.
Investing in stocks today is very different from the past, but one thing hasn't changed - to study about a stock before putting money in.
A stock chart contains data that is publicly available and accurate by itself. By having certainty in data quality, we can comfortably study charts and make investment judgements.
At Chart Story, we believe stock prices move for a reason. Our objective is to share what we believe.
More articles on KLSE Stocks Review
YTL (0025) The Story behind the Chart of YTL CORPORATION BERHAD
Created by ChartStory72 | May 05, 2022
DSONIC (5216) The Story behind the Chart of DATASONIC GROUP BERHAD
Created by ChartStory72 | Apr 18, 2022
FRONTKN (0128) The Story behind the Chart of FRONTKEN CORP BHD
Created by ChartStory72 | Jan 18, 2022
ANNJOO (6556) The Story behind the Chart of ANN JOO RESOURCES BHD
Created by ChartStory72 | Jan 17, 2022
EVERGRN (5101) The Story behind the Chart of EVERGREEN FIBREBOARD BERHAD
Created by ChartStory72 | Jan 11, 2022
TEXCYCL (0089) The Story behind the Chart of TEX CYCLE TECHNOLOGY (M) BERHAD
Created by ChartStory72 | Jan 10, 2022
Wong (7050) The Story behind the Chart of WONG ENGINEERING CORPORATION BERHAD
Created by ChartStory72 | Jan 03, 2022
TOPGLOV ( 7113) The Story behind the Chart of TOP GLOVE CORP BHD
Created by ChartStory72 | Dec 06, 2021
Discussions
Be the first to like this. Showing 0 of 0 comments
Post a Comment
Featured Posts


Latest Videos


Apps


Top Articles
1
Stock Market Enthusiast
YTLPower: Hammer + Oversold + Strong Support Level Means Bullish Reversal?
2
CEO Morning Brief
These Big-cap Stocks on Bursa Pay More Than 5% Dividend Yield
3
Mercury Securities Research
4
Mercury Securities Research
5
Mercury Securities Research
6
7
Mercury Securities Research
8
Mercury Securities Research
#
Stock
Score
Daily Stocks
Stock Name
Last
Change
Volume
Stock Name
Last
Change
Volume
Stock Name
Last
Change
Volume
MQ Trading Signals
Stock
Time
Signal
Duration
Stock
Time
Signal
Duration
Featured Advertisers / Partners


Ride The Bull Short The Bear
CS Tan
4.9 / 5.0
This book is the result of the author's many years of experience and observation throughout his 26 years in the stockbroking industry. It was written for general public to learn to invest based on facts and not on fantasies or hearsay....