


KLSE Stocks Review
TAWIN (7097) The Story behind the Chart of TA WIN HOLDINGS BHD

ChartStory72
Publish date: Wed, 11 Aug 2021, 07:13 PM
ChartStory72
0 211
We post FREE chart reviews on KLSE daily Top Gainers and Most Actively Traded Counters. We are also giving out free reviews for our subs as well. Come join us on Telegram and PM us to learn more and request for the stocks you need reviewing for FREE.
Facebook : https://www.facebook.com/thechartstory
Telegram : https://t.me/thechartstory
Facebook : https://www.facebook.com/thechartstory
Telegram : https://t.me/thechartstory
Tawin 7097
An update from the previous post. You may access the previous post here: https://klse.i3investor.com/blogs/KLSEChartStories/2021-06-15-story-h1566850598-TAWIN_7097_The_Story_behind_the_Chart_of_TA_WIN_HOLDINGS_BHD.jsp
Another one of my accurate reviews. You all may wonder, how can it be so accurate? Magic? My answer to you is Mathematics. Everything that happens in the chart are all carefully calculated by the bankers. Our job is to find out their calculations and follow them, it is that easy. The hard part? Figuring out their formula.
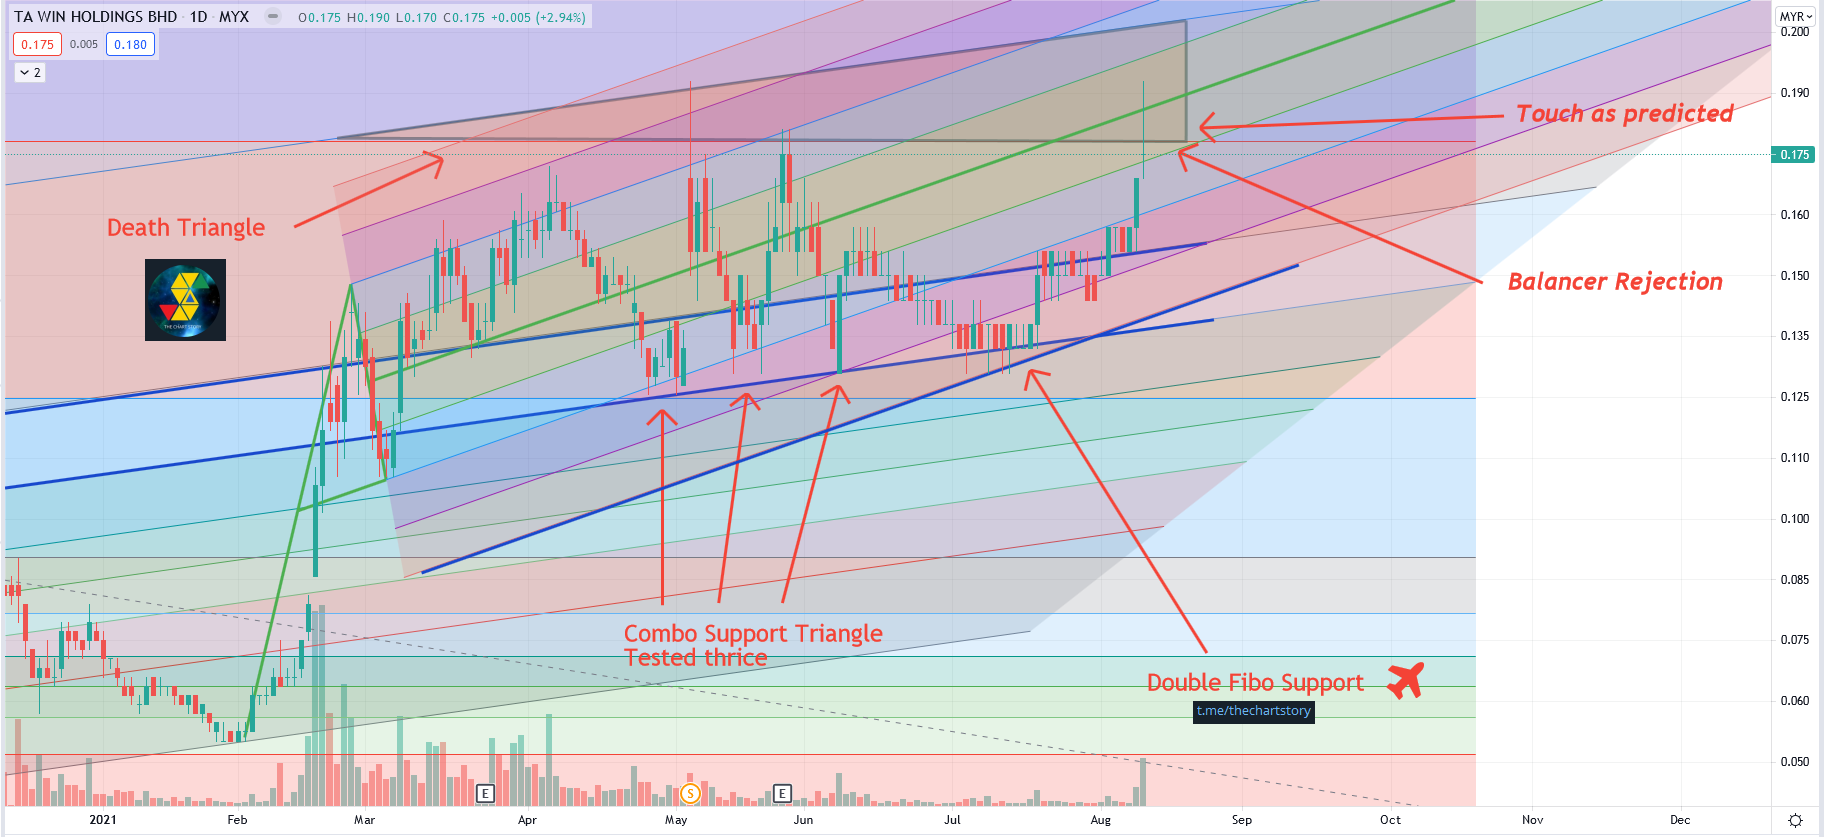
As previously mentioned, prices are inclined to return back towards the Death Triangle because the Quadruple Fibonacci Support shows tons of strength with their last Support as a Double Fibonacci Support. Such combination of math are not to be taken lightly.
Now we can see that prices are facing some rejection at the Death Triangle. The rejection may seem strong because the Balancer are also at work, pushing the prices to not break above it. It is critical for the next few days as it determines whether the prices can go higher or not. Time to observe.
Industry: Metals.
Come join us on Telegram and PM us to learn more and request for the stocks you need reviewing for FREE.
Telegram : https://t.me/thechartstory
In this fast-moving digital world, we get information in a few clicks.
However, we rarely get first-hand information and more often we get misleading news.
Investing in stocks today is very different from the past, but one thing hasn't changed - to study about a stock before putting money in.
A stock chart contains data that is publicly available and accurate by itself. By having certainty in data quality, we can comfortably study charts and make investment judgements.
At Chart Story, we believe stock prices move for a reason. Our objective is to share what we believe.
More articles on KLSE Stocks Review
YTL (0025) The Story behind the Chart of YTL CORPORATION BERHAD
Created by ChartStory72 | May 05, 2022
DSONIC (5216) The Story behind the Chart of DATASONIC GROUP BERHAD
Created by ChartStory72 | Apr 18, 2022
FRONTKN (0128) The Story behind the Chart of FRONTKEN CORP BHD
Created by ChartStory72 | Jan 18, 2022
ANNJOO (6556) The Story behind the Chart of ANN JOO RESOURCES BHD
Created by ChartStory72 | Jan 17, 2022
EVERGRN (5101) The Story behind the Chart of EVERGREEN FIBREBOARD BERHAD
Created by ChartStory72 | Jan 11, 2022
TEXCYCL (0089) The Story behind the Chart of TEX CYCLE TECHNOLOGY (M) BERHAD
Created by ChartStory72 | Jan 10, 2022
Wong (7050) The Story behind the Chart of WONG ENGINEERING CORPORATION BERHAD
Created by ChartStory72 | Jan 03, 2022
TOPGLOV ( 7113) The Story behind the Chart of TOP GLOVE CORP BHD
Created by ChartStory72 | Dec 06, 2021
Discussions
Be the first to like this. Showing 0 of 0 comments
Post a Comment
Featured Posts


Latest Videos


Apps


Top Articles
1
TA Sector Research
2
3
4
save malaysia!
6
save malaysia!
7
BFM Podcast
8
BFM Podcast
#
Stock
Score
Daily Stocks
Stock Name
Last
Change
Volume
MQ Trading Signals
Stock
Time
Signal
Duration
Stock
Time
Signal
Duration
Featured Advertisers / Partners


Ride The Bull Short The Bear
CS Tan
4.9 / 5.0
This book is the result of the author's many years of experience and observation throughout his 26 years in the stockbroking industry. It was written for general public to learn to invest based on facts and not on fantasies or hearsay....