


KLSE Stocks Review
FITTERS (9318) The Story behind the Chart of FITTERS DIVERSIFIED BERHAD

ChartStory72
Publish date: Thu, 12 Aug 2021, 07:43 PM
ChartStory72
0 211
We post FREE chart reviews on KLSE daily Top Gainers and Most Actively Traded Counters. We are also giving out free reviews for our subs as well. Come join us on Telegram and PM us to learn more and request for the stocks you need reviewing for FREE.
Facebook : https://www.facebook.com/thechartstory
Telegram : https://t.me/thechartstory
Facebook : https://www.facebook.com/thechartstory
Telegram : https://t.me/thechartstory
Fitters 9318
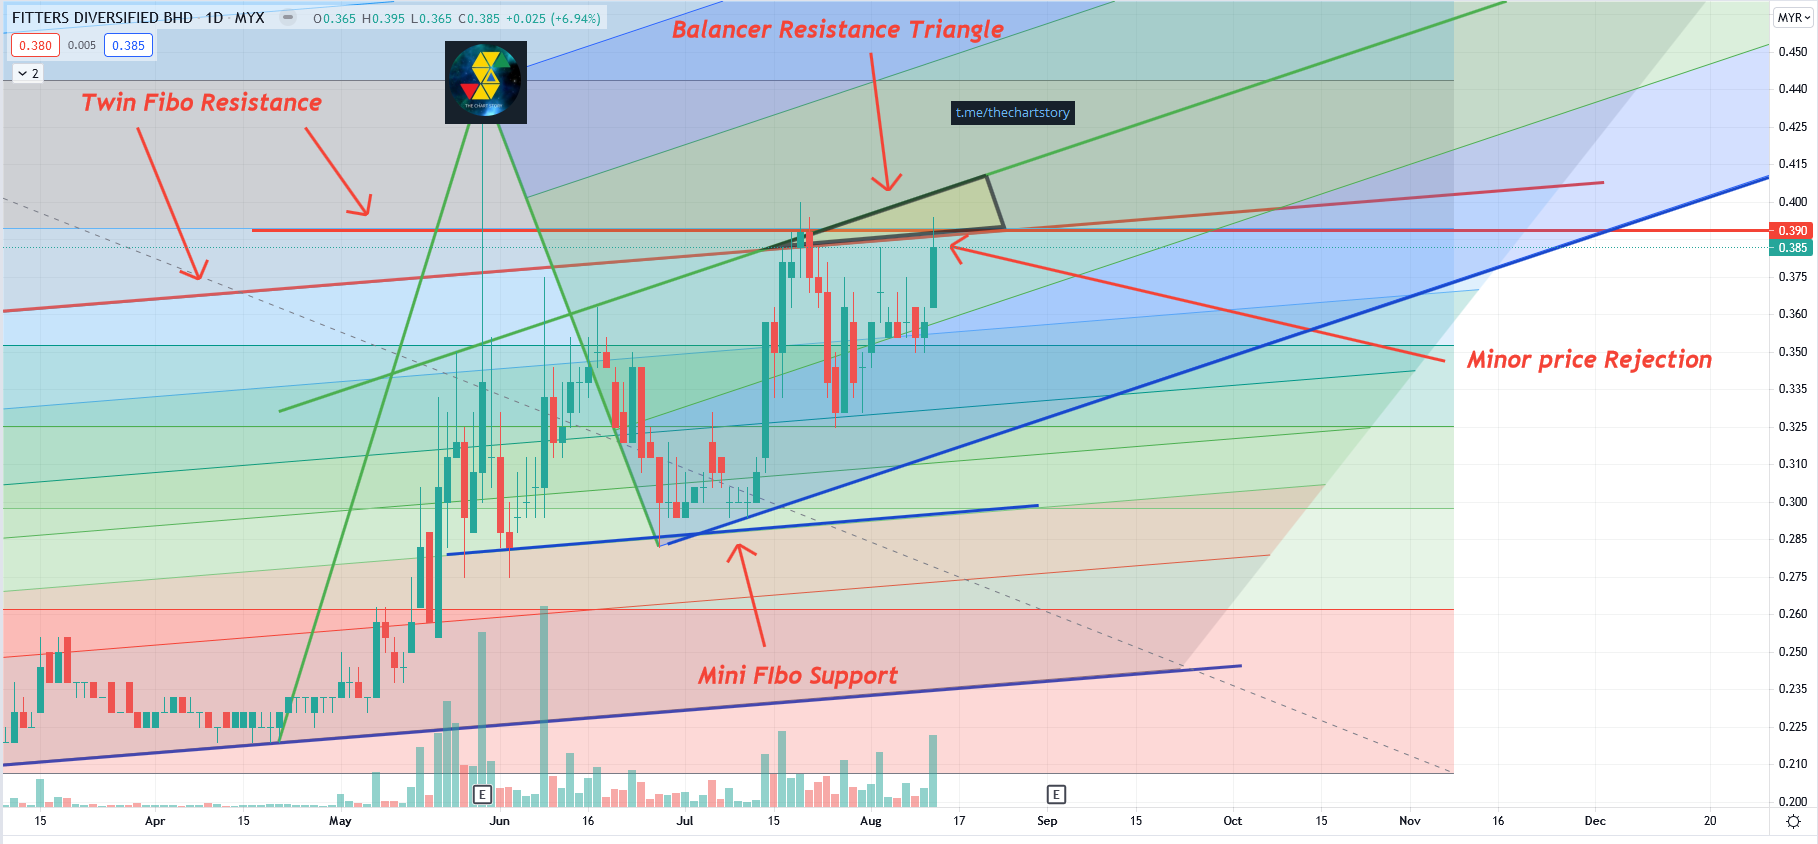
Overall in the bigger picture we can see that prices are in a ranging uptrend. After zooming in we can see that prices are starting to transition from a ranging uptrend towards a stronger uptrend. This indicates the collection phase is over.
However, eventhough we know that prices are trend transitioning into a stronger uptrend, one last confirmation is needed for the transition to be completed. The last confirmation would be the breakup of the Balancer Resistance Triangle Level. The Balancer Resistance Triangle Level consist of a Twin Fibonacci Resistance combining with the Balancer.
Such a combination would be the last test for the 3rd wave and a break up will serve as a confirmation for the uptrend. If fail to do so, prices will head down lower and the transition has failed.
Industry: Industrial Materials, Components & Equipment.
Come join us on Telegram and PM us to learn more and request for the stocks you need reviewing for FREE.
Telegram : https://t.me/thechartstory
In this fast-moving digital world, we get information in a few clicks.
However, we rarely get first-hand information and more often we get misleading news.
Investing in stocks today is very different from the past, but one thing hasn't changed - to study about a stock before putting money in.
A stock chart contains data that is publicly available and accurate by itself. By having certainty in data quality, we can comfortably study charts and make investment judgements.
At Chart Story, we believe stock prices move for a reason. Our objective is to share what we believe.
More articles on KLSE Stocks Review
YTL (0025) The Story behind the Chart of YTL CORPORATION BERHAD
Created by ChartStory72 | May 05, 2022
DSONIC (5216) The Story behind the Chart of DATASONIC GROUP BERHAD
Created by ChartStory72 | Apr 18, 2022
FRONTKN (0128) The Story behind the Chart of FRONTKEN CORP BHD
Created by ChartStory72 | Jan 18, 2022
ANNJOO (6556) The Story behind the Chart of ANN JOO RESOURCES BHD
Created by ChartStory72 | Jan 17, 2022
EVERGRN (5101) The Story behind the Chart of EVERGREEN FIBREBOARD BERHAD
Created by ChartStory72 | Jan 11, 2022
TEXCYCL (0089) The Story behind the Chart of TEX CYCLE TECHNOLOGY (M) BERHAD
Created by ChartStory72 | Jan 10, 2022
Wong (7050) The Story behind the Chart of WONG ENGINEERING CORPORATION BERHAD
Created by ChartStory72 | Jan 03, 2022
TOPGLOV ( 7113) The Story behind the Chart of TOP GLOVE CORP BHD
Created by ChartStory72 | Dec 06, 2021
Discussions
Be the first to like this. Showing 0 of 0 comments
Post a Comment
Featured Posts


Latest Videos


Apps


Top Articles
1
TA Sector Research
2
3
4
save malaysia!
6
save malaysia!
7
BFM Podcast
8
BFM Podcast
#
Stock
Score
Daily Stocks
Stock Name
Last
Change
Volume
Stock Name
Last
Change
Volume
Stock Name
Last
Change
Volume
MQ Trading Signals
Stock
Time
Signal
Duration
Stock
Time
Signal
Duration
Featured Advertisers / Partners


Ride The Bull Short The Bear
CS Tan
4.9 / 5.0
This book is the result of the author's many years of experience and observation throughout his 26 years in the stockbroking industry. It was written for general public to learn to invest based on facts and not on fantasies or hearsay....