


KLSE Stocks Review
AVI (8885) The Story behind the Chart of AVILLION BERHAD

ChartStory72
Publish date: Mon, 16 Aug 2021, 07:15 PM
ChartStory72
0 211
We post FREE chart reviews on KLSE daily Top Gainers and Most Actively Traded Counters. We are also giving out free reviews for our subs as well. Come join us on Telegram and PM us to learn more and request for the stocks you need reviewing for FREE.
Facebook : https://www.facebook.com/thechartstory
Telegram : https://t.me/thechartstory
Facebook : https://www.facebook.com/thechartstory
Telegram : https://t.me/thechartstory
An updated version from my previous post which you can access here: https://klse.i3investor.com/blogs/KLSEChartStories/2021-08-09-story-h1569676120-AVI_8885_The_Story_behind_the_Chart_of_AVILLION_BERHAD.jsp
AVI 8885
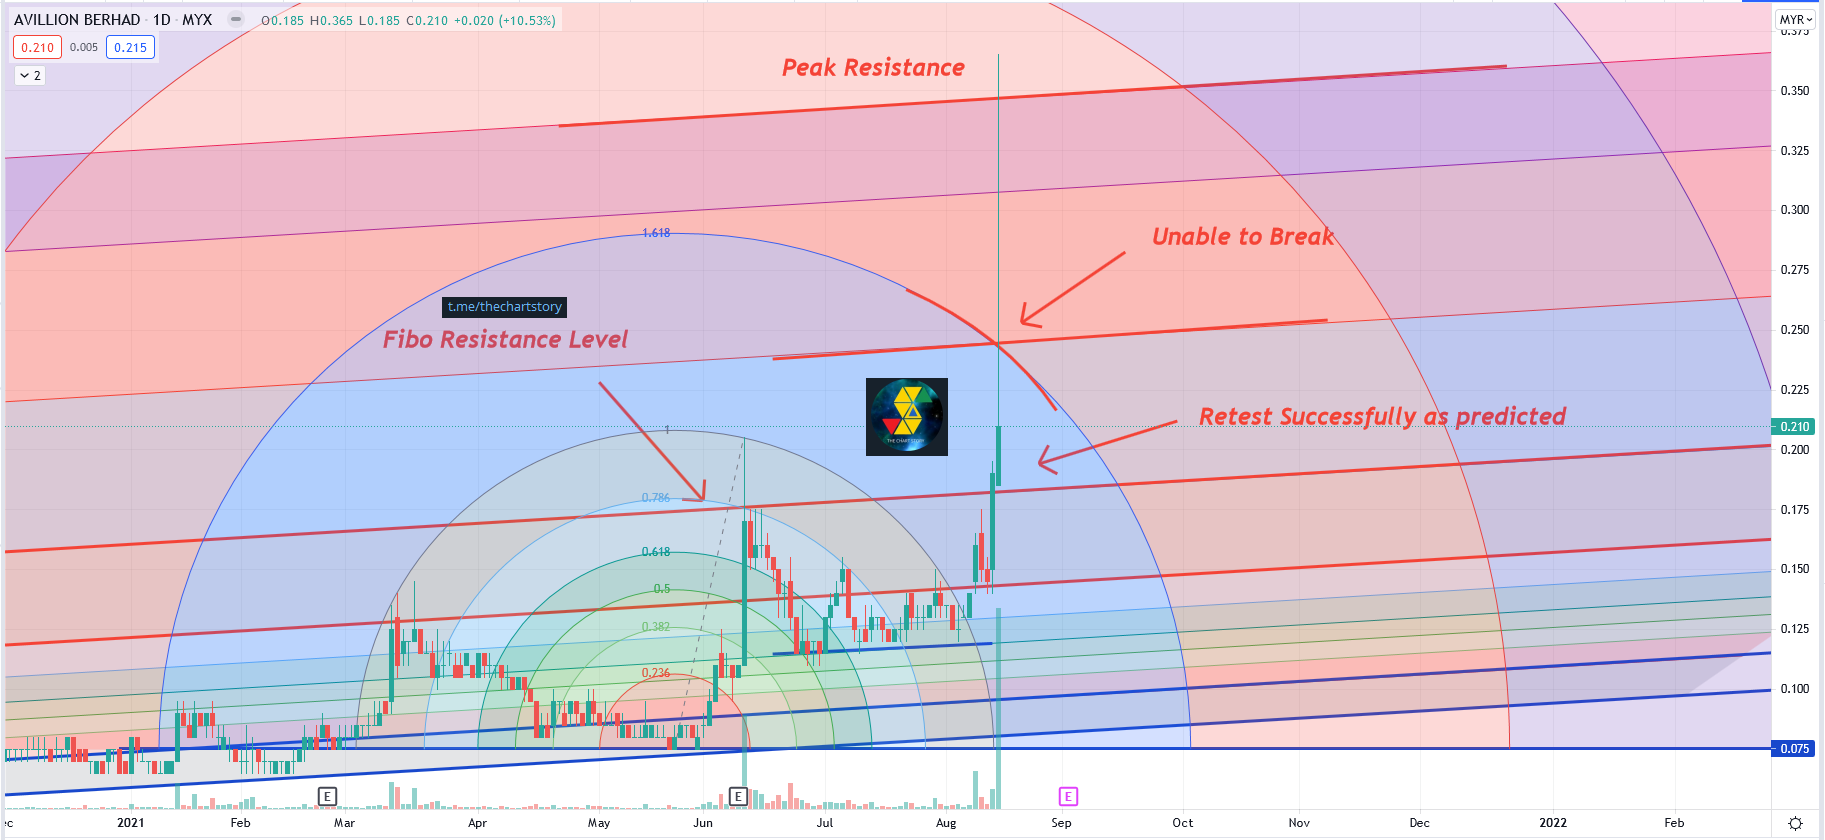
To my surprise, I never thought that prices will re-test that level so quickly but yea another win for the Fibonacci Numbers for showing the future before it happens again. From the super long green candle, I can only conclude that the bankers are rushing to push, maybe they are on a deadline or something.
Now let's analyse what's going on and try to grasp what are the banker's next move. First we see that prices spiked all the way up towards the highest Peak Fibonacci Resistance, the 4.236. As the name states, that is the highest prices will ever go, and it is also the hardest level to break. Whoever bought at that level, good luck bro.
Next we also can see that prices got pushed all the way down and couldn't stay above the Combo Fibonacci Level of 1.618 + 2.618. This indicates weakness, at least in the short term. However, prices are still maintaining above the Level 1 Resistance as support. If prices can maintain above it, there's still hope, otherwise, good luck bro.
Industry: Travel, Leisure & Hospitality.
Come join us on Telegram and PM us to learn more and request for the stocks you need reviewing for FREE.
Telegram : https://t.me/thechartstory
In this fast-moving digital world, we get information in a few clicks.
However, we rarely get first-hand information and more often we get misleading news.
Investing in stocks today is very different from the past, but one thing hasn't changed - to study about a stock before putting money in.
A stock chart contains data that is publicly available and accurate by itself. By having certainty in data quality, we can comfortably study charts and make investment judgements.
At Chart Story, we believe stock prices move for a reason. Our objective is to share what we believe.
More articles on KLSE Stocks Review
YTL (0025) The Story behind the Chart of YTL CORPORATION BERHAD
Created by ChartStory72 | May 05, 2022
DSONIC (5216) The Story behind the Chart of DATASONIC GROUP BERHAD
Created by ChartStory72 | Apr 18, 2022
FRONTKN (0128) The Story behind the Chart of FRONTKEN CORP BHD
Created by ChartStory72 | Jan 18, 2022
ANNJOO (6556) The Story behind the Chart of ANN JOO RESOURCES BHD
Created by ChartStory72 | Jan 17, 2022
EVERGRN (5101) The Story behind the Chart of EVERGREEN FIBREBOARD BERHAD
Created by ChartStory72 | Jan 11, 2022
TEXCYCL (0089) The Story behind the Chart of TEX CYCLE TECHNOLOGY (M) BERHAD
Created by ChartStory72 | Jan 10, 2022
Wong (7050) The Story behind the Chart of WONG ENGINEERING CORPORATION BERHAD
Created by ChartStory72 | Jan 03, 2022
TOPGLOV ( 7113) The Story behind the Chart of TOP GLOVE CORP BHD
Created by ChartStory72 | Dec 06, 2021
Discussions
Be the first to like this. Showing 0 of 0 comments
Post a Comment
Featured Posts


Latest Videos


Apps


Top Articles
1
TA Sector Research
2
3
4
save malaysia!
6
save malaysia!
7
BFM Podcast
8
BFM Podcast
#
Stock
Score
Daily Stocks
Stock Name
Last
Change
Volume
Stock Name
Last
Change
Volume
Stock Name
Last
Change
Volume
MQ Trading Signals
Stock
Time
Signal
Duration
Stock
Time
Signal
Duration
Featured Advertisers / Partners


Ride The Bull Short The Bear
CS Tan
4.9 / 5.0
This book is the result of the author's many years of experience and observation throughout his 26 years in the stockbroking industry. It was written for general public to learn to invest based on facts and not on fantasies or hearsay....