


KLSE Stocks Review
QES (0196) The Story behind the Chart of QES GROUP BHD

ChartStory72
Publish date: Tue, 26 Oct 2021, 11:49 AM
ChartStory72
0 211
We post FREE chart reviews on KLSE daily Top Gainers and Most Actively Traded Counters. We are also giving out free reviews for our subs as well. Come join us on Telegram and PM us to learn more and request for the stocks you need reviewing for FREE.
Facebook : https://www.facebook.com/thechartstory
Telegram : https://t.me/thechartstory
Facebook : https://www.facebook.com/thechartstory
Telegram : https://t.me/thechartstory
QES 0196
Let's do something different today as everyday you see post all about Fibonacci. Today I am going to do a comparison between Fibonnaci TA and Normal TA. To access the remaining post you can follow my Telegram Channel, it is all inside my Channel. Link is at the Bottom.
Normal TA VS Fibonacci TA
Combo of both Tas
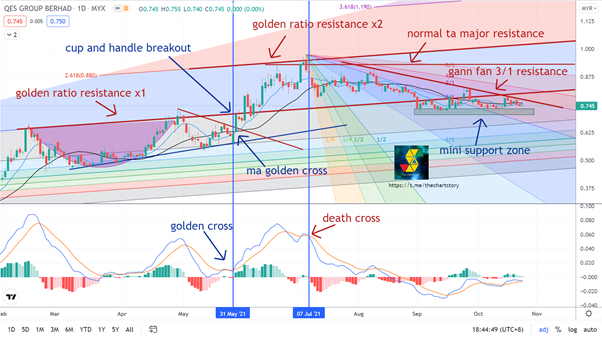
As usual let’s combine both Tas together. By combining perspective side by side, we gain the ability to see Combo TA Critical Areas. By using both methods we can now see the Multiple Critical TA Combos such as:
- Cup & Handle + Fibonacci Golden Ratiox1 + MA Golden Cross + MACD Golden Cross (quadra breakout power)
- Fibonacci Golden ratio resistancex2 + normal ta major resistance + MACD Death Cross
Conclusion
Normal TA - Cleaner and able to see obvious support/resistance but unable to see hidden support/resistance. One good side is there are supporting indicator such as RSI.
Fibonacci TA - Harder to draw but able to see the Hidden Support/Resistance and major Fibonacci levels. Able to forecast the future, find out Hidden Resistance and Support levels that respect by the bankers.
Come join us on Telegram and PM us to learn more and request for the stocks you need reviewing for FREE. We also post other extra contents that we do not share here, which includes weekly recap and weekly analysis.
Student Analysis
Telegram : https://t.me/thechartstory
In this fast-moving digital world, we get information in a few clicks.
However, we rarely get first-hand information and more often we get misleading news.
Investing in stocks today is very different from the past, but one thing hasn't changed - to study about a stock before putting money in.
A stock chart contains data that is publicly available and accurate by itself. By having certainty in data quality, we can comfortably study charts and make investment judgements.
At Chart Story, we believe stock prices move for a reason. Our objective is to share what we believe.
More articles on KLSE Stocks Review
YTL (0025) The Story behind the Chart of YTL CORPORATION BERHAD
Created by ChartStory72 | May 05, 2022
DSONIC (5216) The Story behind the Chart of DATASONIC GROUP BERHAD
Created by ChartStory72 | Apr 18, 2022
FRONTKN (0128) The Story behind the Chart of FRONTKEN CORP BHD
Created by ChartStory72 | Jan 18, 2022
ANNJOO (6556) The Story behind the Chart of ANN JOO RESOURCES BHD
Created by ChartStory72 | Jan 17, 2022
EVERGRN (5101) The Story behind the Chart of EVERGREEN FIBREBOARD BERHAD
Created by ChartStory72 | Jan 11, 2022
TEXCYCL (0089) The Story behind the Chart of TEX CYCLE TECHNOLOGY (M) BERHAD
Created by ChartStory72 | Jan 10, 2022
Wong (7050) The Story behind the Chart of WONG ENGINEERING CORPORATION BERHAD
Created by ChartStory72 | Jan 03, 2022
TOPGLOV ( 7113) The Story behind the Chart of TOP GLOVE CORP BHD
Created by ChartStory72 | Dec 06, 2021
Discussions
Be the first to like this. Showing 0 of 0 comments
Post a Comment
Featured Posts
Introducing MY's First IPO Fund for Sophisticated Investors!
New Update. Discover investment communities that resonate with your ideas
M & A Value Partners IPO Equity Fund has been launched - Targeted 13% Return p.a
Latest Videos


Apps


Top Articles
1
TA Sector Research
2
3
4
save malaysia!
6
save malaysia!
7
BFM Podcast
8
BFM Podcast
#
Stock
Score
Daily Stocks
Stock Name
Last
Change
Volume
Stock Name
Last
Change
Volume
Stock Name
Last
Change
Volume
MQ Trading Signals
Stock
Time
Signal
Duration
Stock
Time
Signal
Duration
SUNWAY BERHAD - IRREDEEMABLE CONVERTIBLE PREFERENCE SHARES 2020/2025
2024-09-10 08:00:00
EMA 5
Daily
Featured Advertisers / Partners


Ride The Bull Short The Bear
CS Tan
4.9 / 5.0
This book is the result of the author's many years of experience and observation throughout his 26 years in the stockbroking industry. It was written for general public to learn to invest based on facts and not on fantasies or hearsay....