


Important time-tested proven market rules or tips
TA reading of Hiaptek - Buy signal appears on 7/2/2022

OTB
Publish date: Tue, 08 Feb 2022, 02:02 PM
Dear valued members,
Special note:
This is an educational program, stock selection criteria is based on TA and FA facts.
This article is strictly for reference only. It is not a buy recommendation. Never trust anyone as far as your investment is concerned. Please do your homework before you decide to invest. It is your money, you make your own decision and you are responsible for the final outcome.
I have a certain code of ethics when I write my article in I3.
If the article is beneficial to all the readers here, I will write and post it.
If it is harmful to the majority, I will avoid it at all times.
I have followed this code of ethics since day one when I posted my article in I3.
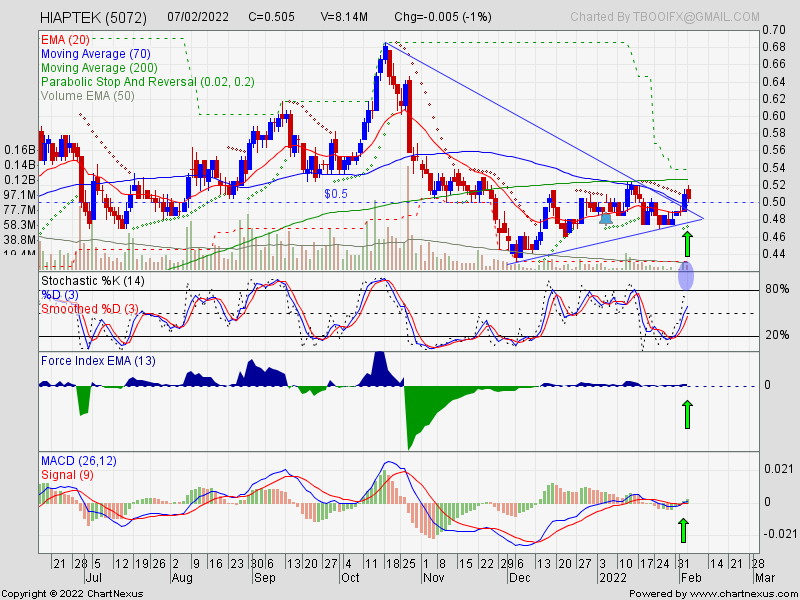
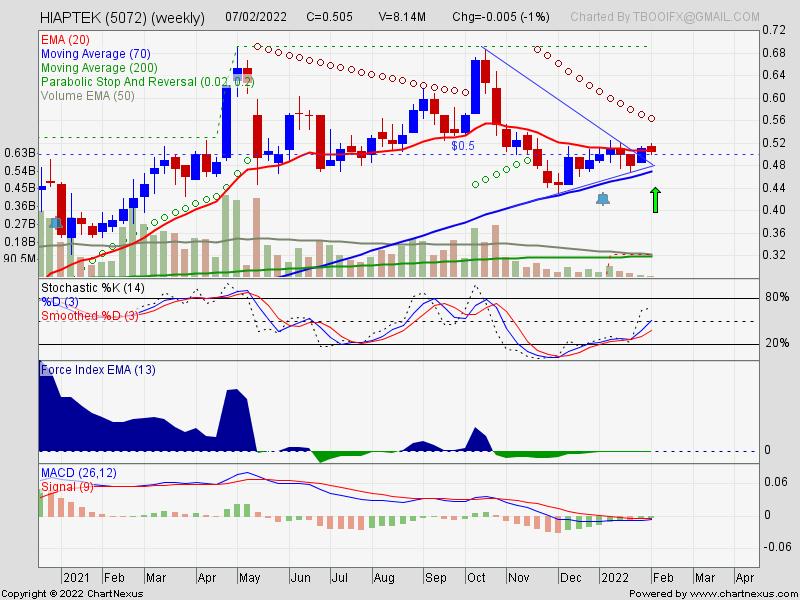
Enclosed are the latest technical charts of Hiaptek (daily and weekly) for your perusal.
TA readings
- There is a symmetrical triangle formed in both the daily chart and weekly chart of Hiaptek.
- The share price at 0.53 is higher than the 20-day EMA, 70-day SMA and the 200-day SMA.
- Force Index, Parabolic SAR, Stochastic and Daily MACD showed a buy signal with Volume breakout.
- The Parabolic SAR buy signal appeared on the daily chart on 7/2/2022.
- The share price breaks above 20-day EMA at 0.50 on 7/2/2022, it is a buy signal.
- The share price is above the "Golden Cross Buy" signal which is at 0.50 on 7/2/2022.
- The share price showed a breakout from a symmetrical triangle above 0.50 on 7/2/2022.
- Daily MACD shows a buy signal with high volume breakout, both Blue and Red lines crossed above zero level. It means the uptrend momentum is strong.
- Force Index showed a buy signal with high Volume, it means fund or money is flowing into this stock.
- The share price fulfills all 5 Important Buy Signals.
- The share price crosses above 0.51 in the weekly chart which is at the 20-week EMA.
- I believe the uptrend momentum is very strong and the share price is very bullish.
- I prefer the share price to cross above 0.53 convincingly which is at 200-day SMA to confirm the uptrend is truly formed.
FA report and recommendation report
- Please read the links below.
- https://klse.i3investor.com/blogs/OoiTeikBee/2021-07-17-story-h1568038457-Hiaptek_Unearthing_the_jewel_of_the_east_Steel_stock.jsp
- https://klse.i3investor.com/blogs/OoiTeikBee/2021-10-07-story-h1591936603-Hiaptek_Unearthing_the_jewel_of_the_east_part_2_updated_6_10_2021.jsp
The final decision to buy is always yours.
Thank you.
Ooi
寧可天下人負我, 休教我負天下人
Disclaimer :
This is an educational program, stock selection criteria is based on TA and FA facts.
Please be informed that the aforesaid stocks are solely for the purpose of education only ; it is neither a trading advice nor an invitation to trade. For trading advice, please speak to your remisier or dealer representative.
The final decision to buy is always yours.
Related Stocks
| Chart | Stock Name | Last | Change | Volume |
|---|
More articles on Important time-tested proven market rules or tips
Jaks - Annual net profit of Hai Duong power plant in 2021 is RM 248 million
Created by OTB | Mar 04, 2020
Featured Posts


MQ Trading Signals
Time
Signal
Duration
Type
2024-07-05 16:40:00
EMA 5
5 Mins
SELL
2024-07-05 16:20:00
EMA 5
5 Mins
BUY
2024-07-05 16:00:00
EMA 5
30 Mins
SELL
2024-07-05 14:55:00
EMA 5
5 Mins
SELL
2024-07-05 14:45:00
EMA 5
5 Mins
BUY
Apps


Top Articles
1
TA Sector Research
BWYS Group Berhad - A Leading Sheet Metal and Scaffoldings Manufacturer
2
Kenanga Research & Investment
3
4
Kenanga Research & Investment
5
save malaysia!
6
TA Sector Research
7
8
#
Stock
Score
Daily Stocks
Stock Name
Last
Change
Volume
Stock Name
Last
Change
Volume
Stock Name
Last
Change
Volume
Featured Advertisers / Partners


Ride The Bull Short The Bear
CS Tan
4.9 / 5.0
This book is the result of the author's many years of experience and observation throughout his 26 years in the stockbroking industry. It was written for general public to learn to invest based on facts and not on fantasies or hearsay....
honweesin
https://klse.i3investor.com/blogs/AmInvestResearch/2022-02-09-story-h1598373410-Stocks_on_Radar_Hiap_Teck_Venture_5072.jsp
2022-02-09 10:33