


Candlestick & Breakout Patterns
JOHOTIN - Third Attempt To Break Historical High With This Reliable Pattern?

Ming Jong Tey
Publish date: Tue, 27 Dec 2016, 11:40 AM
Ming Jong Tey
0 68
Understand the psychology behind the candlestick & breakout pattern will give you an edge to realize why the market does what it does and anticipate opportunities before they happen!
Get notified on The Next Best Trading & Investing Ideas for free:
Visit ==> http://www.vipplatform.com/lp/ideas/
"Like" FB Page ==> https://www.facebook.com/BursaSGXcandlestick/
"Join" Telegram Channel ==> https://t.me/BursaSGXCandlestick
Get notified on The Next Best Trading & Investing Ideas for free:
Visit ==> http://www.vipplatform.com/lp/ideas/
"Like" FB Page ==> https://www.facebook.com/BursaSGXcandlestick/
"Join" Telegram Channel ==> https://t.me/BursaSGXCandlestick
JOHOTIN (7167): Bullish
Pattern: Rounding Bottom Breaks Up
As usual, I like to start with a long-term outlook by looking at the weekly chart.
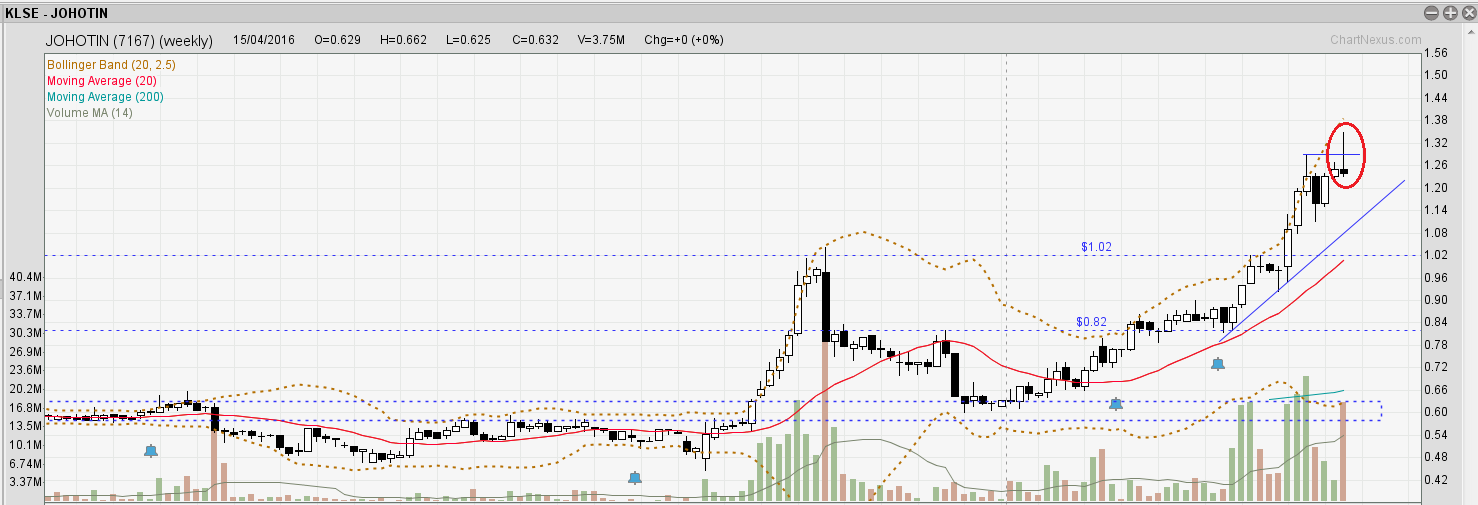
From the weekly chart above, it is showing bullish outlook. The only downside is that last week's candle forms a shooting star and implies losing bullish momentum as buying power is overcome by selling pressure, i.e. rejection from the top.
Let's look at the daily chart to look for more hint below:
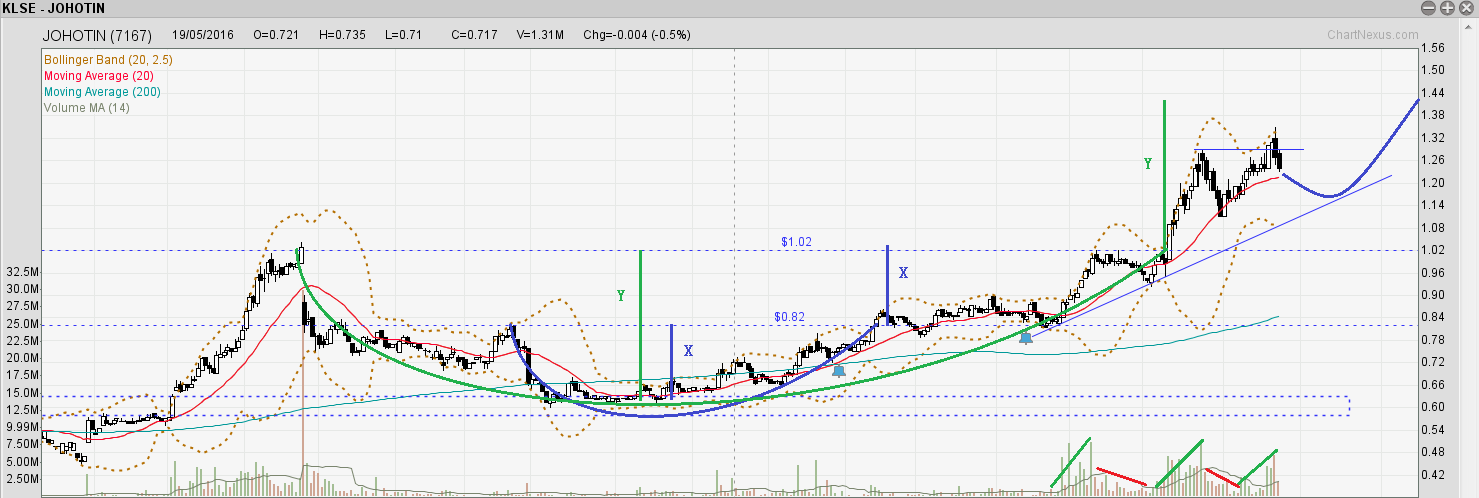
Two rounding bottoms as marked in blue and green are illustrated in the daily chart above. The first rounding bottom in blue with a target price based on a projection of X has been achieved.
The second rounding bottom as marked in green has a target price of 1.42 based on a projection of Y.
After breaking up from the second rounding bottom's neckline, JOHOTIN achieves a high of 1.29 at 23 Nov 2016. Though it breaks above 1.29 recently, the price was rejected quickly from the high.
I expect the price to pull back first (or at least consolidate here) before trying to penetrate the high the third time.
Aggressive players can watch out for a bullish candlestick reversal pattern during this pullback or consolidating period before longing.
Another worth noting point is that every up tide was accompanied by a healthy rising volume while retracing with low volume (i.e. lack of selling interest). This further enhances the bullish case.
I am bullish as long as it stays above 1.05.
Do you spot any interesting pattern in any counters? Feel free to share them :)
Topics That You Do Not Want To Miss
How to determine the "bullishness" of the patterns- https://www.facebook.com/BursaSGXcandlestick/videos/378260995905662/
The Trade Management Technique You Need To Know - http://klse.i3investor.com/blogs/candlestick/114496.jsp
Best Way To Learn To Trade Without A Mentor - http://klse.i3investor.com/blogs/candlestick/113821.jsp
Entry Illustration - http://klse.i3investor.com/blogs/candlestick/113605.jsp
Stop Loss & Safe Trading - http://klse.i3investor.com/blogs/candlestick/113510.jsp
Position Sizing - http://klse.i3investor.com/blogs/candlestick/113061.jsp
Come Up With Trading Ideas & Turn Them Into Investing Ideas - http://klse.i3investor.com/blogs/candlestick/114110.jsp
Cheers,
Ming Jong
Get Update From ==> http://www.vipplatform.com/lp/ideas/
& FB page ==> https://www.facebook.com/BursaSGXcandlestick/
Telegram Channel ==> https://t.me/BursaSGXCandlestick
Contact Via Email ==> ![]()
More articles on Candlestick & Breakout Patterns
IQGROUP Rounding Bottom Breakout With A Beautiful Uptrending Channel
Created by Ming Jong Tey | Jun 29, 2017
RCECAP Rounding Bottom Breakout Plus Trending Up Inside A Channel
Created by Ming Jong Tey | May 25, 2017
PENTA Revisit - Rounding Bottom Breakout In A Long-Term Time Frame
Created by Ming Jong Tey | May 21, 2017
Featured Posts
New Update. Discover investment communities that resonate with your ideas

Apps


Top Articles
1
TA Sector Research
BWYS Group Berhad - A Leading Sheet Metal and Scaffoldings Manufacturer
2
Kenanga Research & Investment
3
Kenanga Research & Investment
4
5
save malaysia!
6
TA Sector Research
7
8
#
Stock
Score
Daily Stocks
Stock Name
Last
Change
Volume
Stock Name
Last
Change
Volume
Stock Name
Last
Change
Volume
MQ Trading Signals
Stock
Time
Signal
Duration
Stock
Time
Signal
Duration
Featured Advertisers / Partners


Ride The Bull Short The Bear
CS Tan
4.9 / 5.0
This book is the result of the author's many years of experience and observation throughout his 26 years in the stockbroking industry. It was written for general public to learn to invest based on facts and not on fantasies or hearsay....