


Candlestick & Breakout Patterns
Comparison Among HEVEA, POHUAT, LIIHEN, LATITUD, FFHB, HOMERIZ - Which One Is The Most Bullish?

Ming Jong Tey
Publish date: Sun, 01 Jan 2017, 05:11 PM
Ming Jong Tey
0 68
Understand the psychology behind the candlestick & breakout pattern will give you an edge to realize why the market does what it does and anticipate opportunities before they happen!
Get notified on The Next Best Trading & Investing Ideas for free:
Visit ==> http://www.vipplatform.com/lp/ideas/
"Like" FB Page ==> https://www.facebook.com/BursaSGXcandlestick/
"Join" Telegram Channel ==> https://t.me/BursaSGXCandlestick
Get notified on The Next Best Trading & Investing Ideas for free:
Visit ==> http://www.vipplatform.com/lp/ideas/
"Like" FB Page ==> https://www.facebook.com/BursaSGXcandlestick/
"Join" Telegram Channel ==> https://t.me/BursaSGXCandlestick
After the publish of this post - The Era of USD/MYR = 5.0 In The Coming 2017, it sparks some interest as shown in the comment section.
Hence, I decide to do a comparison among some of the popular furniture stocks, to find out if the bullish legs are still intact for the furniture exporting sector.
So here we go!
HEVEA (5095)
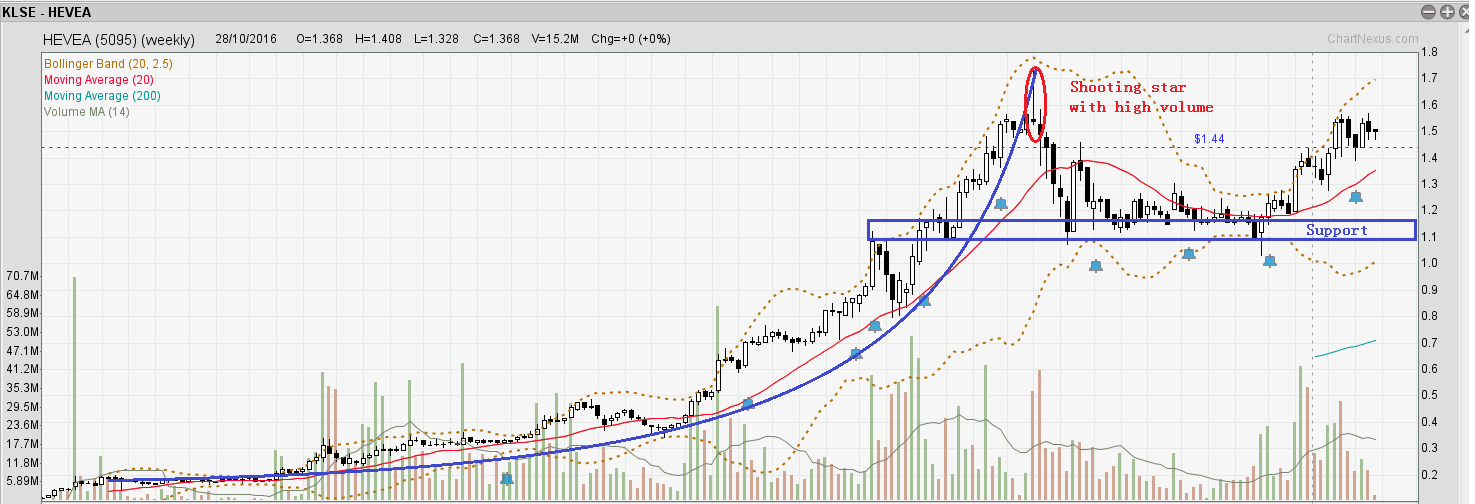
From HEVEA weekly chart above, we can see that it made a pull back after the parabolic run, supported at the blue box region. A shooting star (circled in red) with high volume was spotted at the top before the selloff.
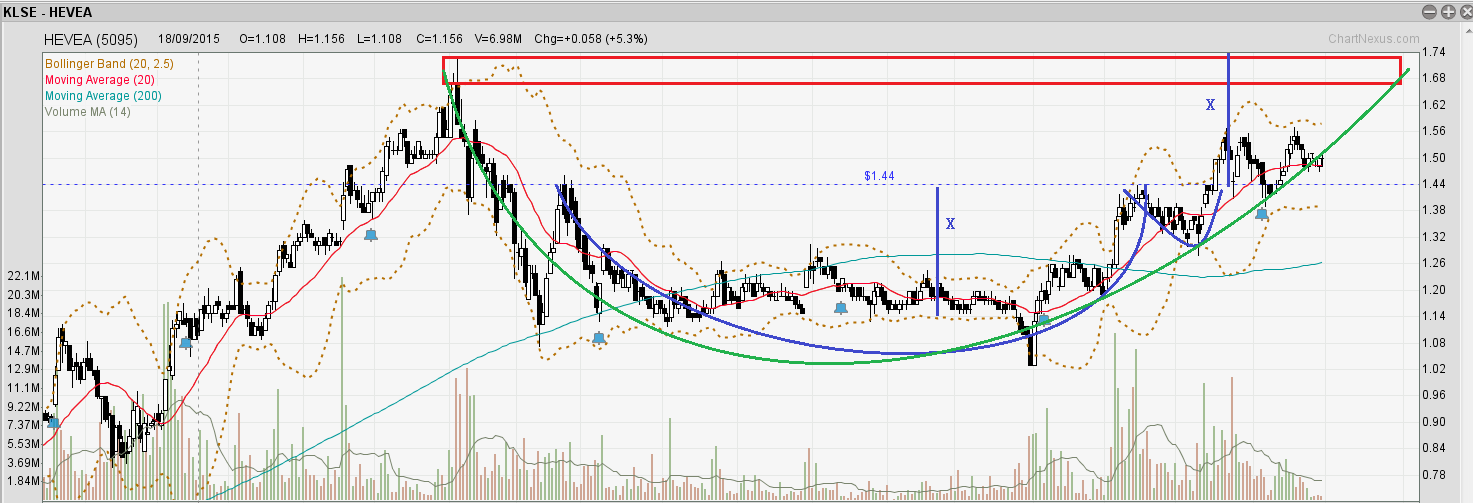
From the daily chart above, price broke up from the cup and handle pattern, backtested the neckline (1.44) and it is on its way to hit the target price of 1.7 based on X projection.
The target price also coincides with the resistance region as boxed in red.
Should the target price be hit, a bigger rounding bottom will be formed as illustrated in green.
As long as the price is staying above the neckline, I am bullish on HEVEA.
POHUAT (7088)
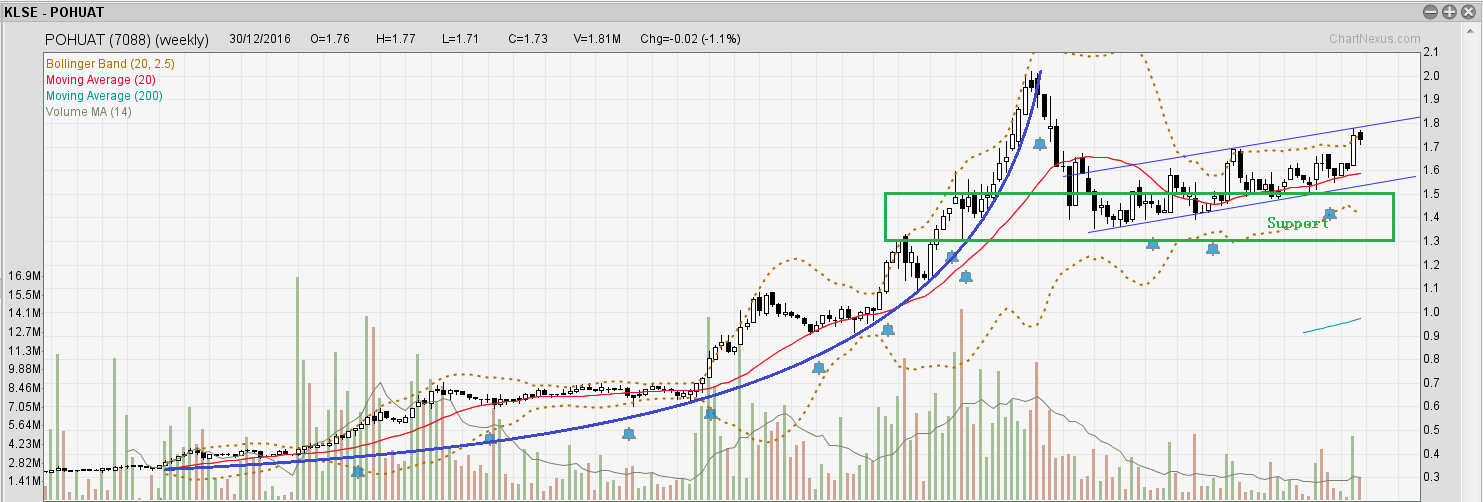
Similar to HEVEA, POHUAT experienced a parabolic run, as shown in the weekly chart above. After broken out of the parabolic curve, it pulled back to the green support area.
The price forms a higher high and higher low within a up-trending channel. I expect a minor pullback before resuming its bullish momentum to break up from the channel.
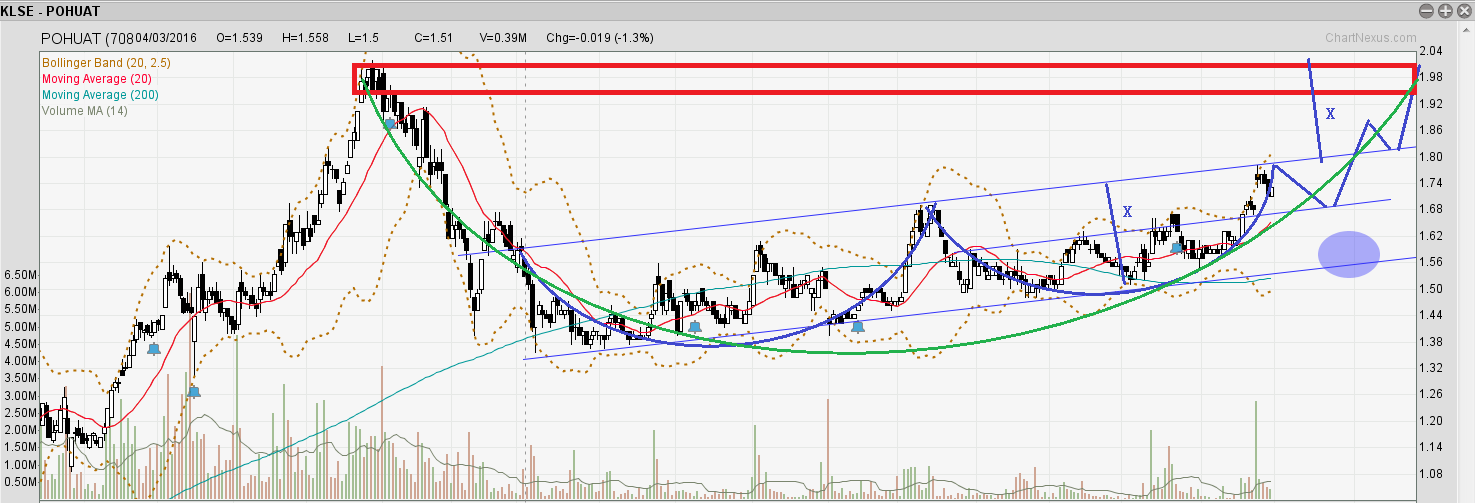
A rounding bottom is forming and a possible handle (should the price retrace). Based on the projection of X from the rounding bottom pattern, 2.0 is reachable, as shown in the possible pathway above.
The target price of 2.0 also coincides with the resistance area as boxed in red.
In addition, a big rounding bottom as marked in green will be formed by the time when it hits 2.0. --> Bullish
I am bullish as long as it does not break the uptrend channel.
LIIHEN (7089)
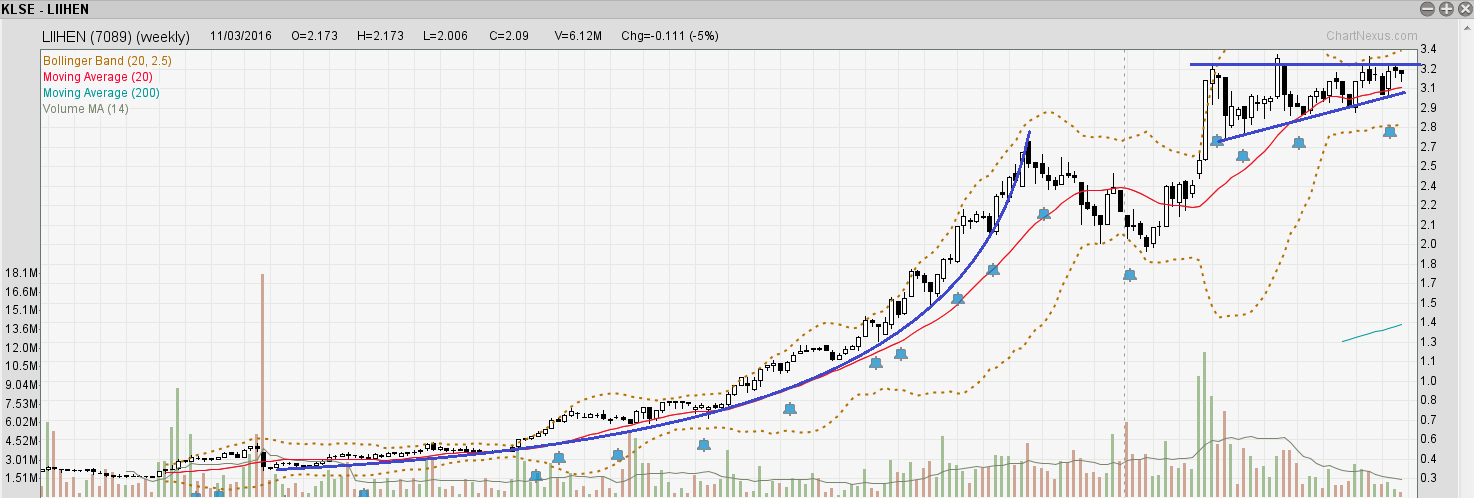
LIIHEN's weekly chart as shown above also paints a similar picture as HEVEA and POHUAT.
After a parabolic run, the price retraced. Subsequently, it broke the previous high and is forming an ascending triangle, pending to break up.
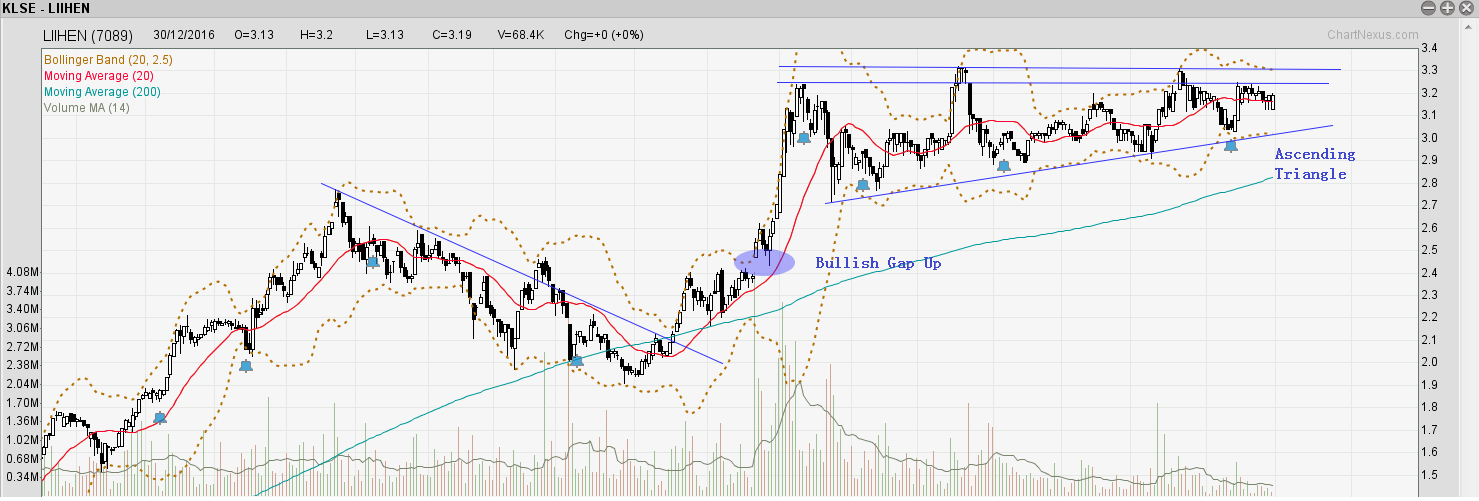
LIIHEN's daily chart above shows a bullish gap and an ascending triangle pending to break up.
As long as it does not break down from the ascending triangle, I am very bullish on LIIHEN.
LATITUD (7006)
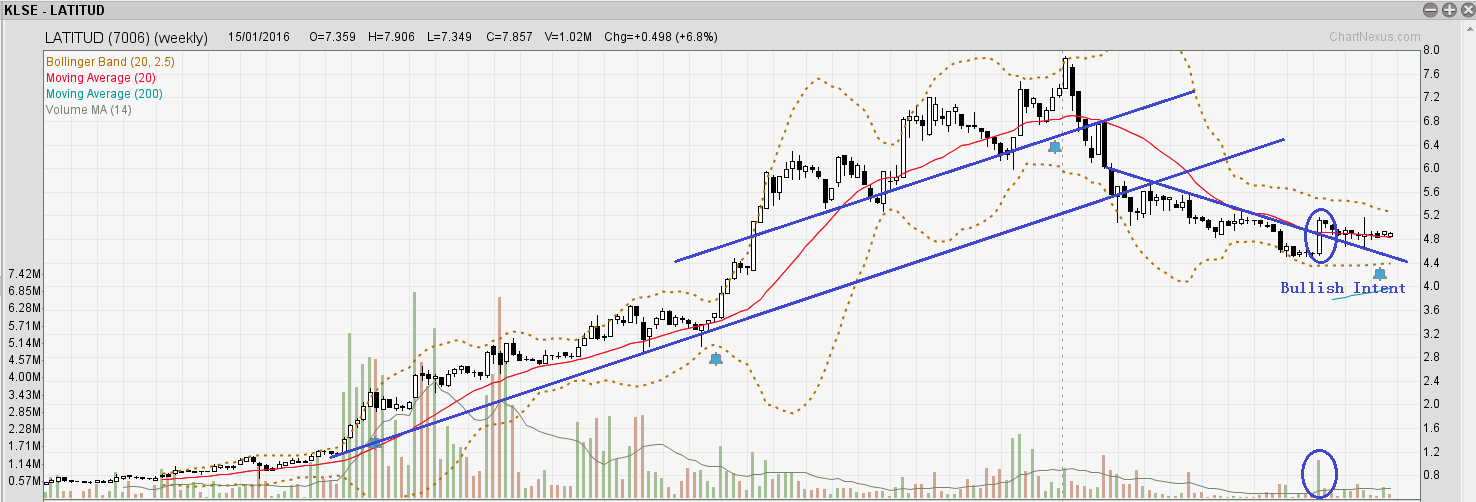
LATITUD's weekly chart above shows a breakdown from two uptrend lines. Price has been going downhill until a bullish candle breaks up to the downtrend line, as circled in blue.
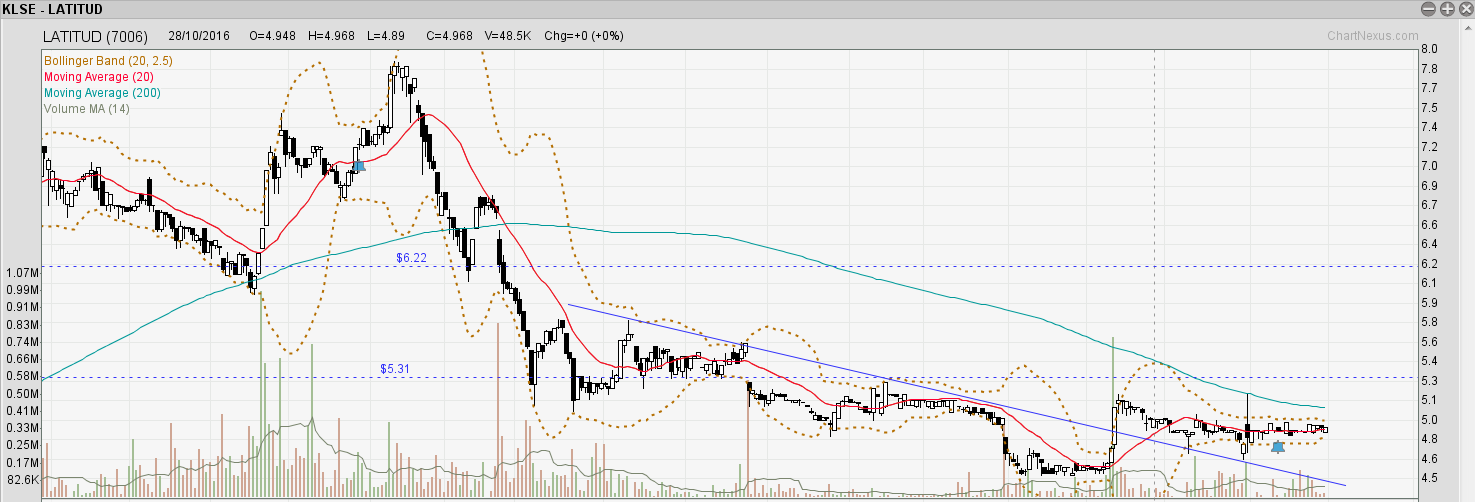
From the daily chart above, not much pattern or interesting stuff are found apart from the bullish candle penetrates the downtrend line. Now Latitud is still in a consolidation phase.
I am neutral in general with slightly bullish bias.
FFHB (8605)
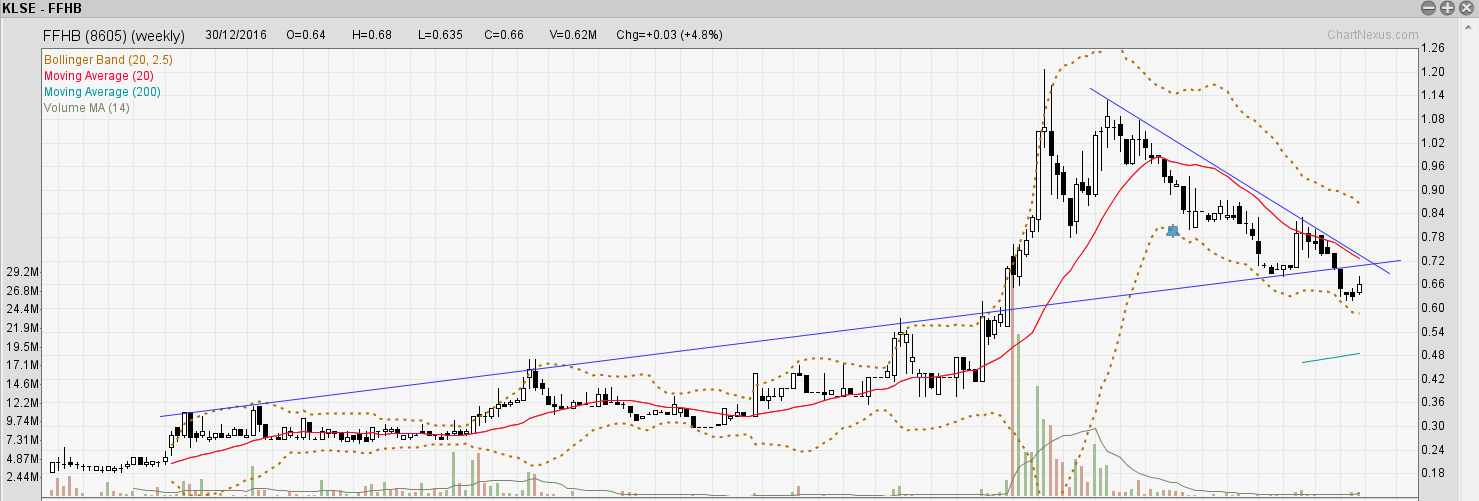
FFHB's weekly chart exhibits a very bearish outlook. After the super sharp rise, the price has been trending down and broke the long-term uptrend line. It has now become a resistance trendline.
There is no bullish sign of FFHB at the moment unless it breaks up above the resistance trendline.
HOMERIZ (5160)
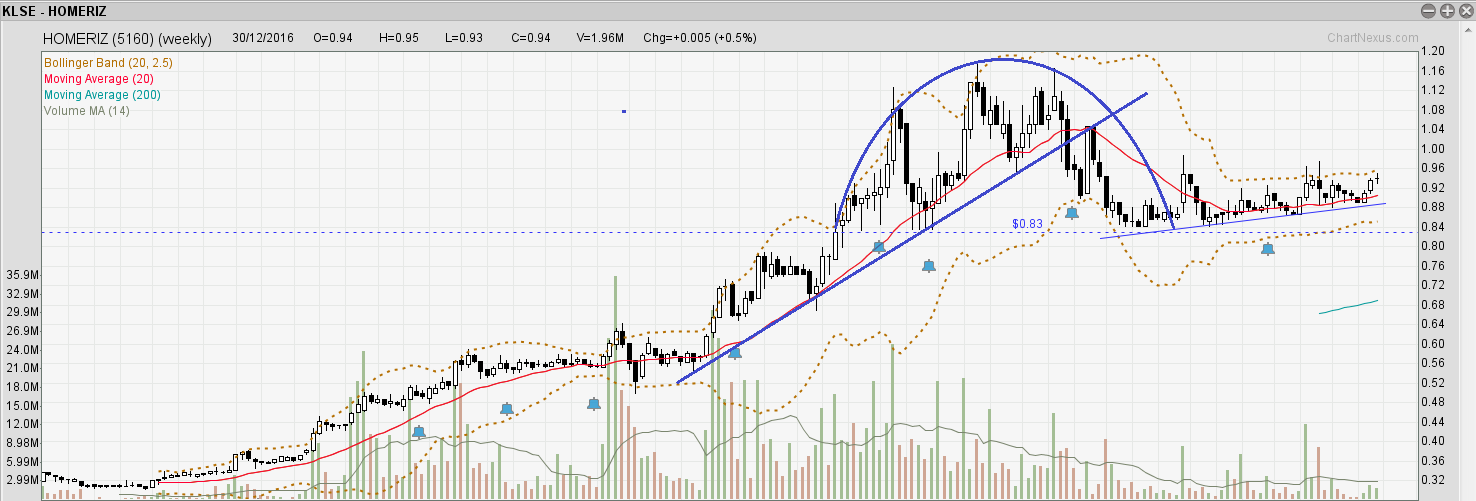
From HOMERIZ's weekly chart above, we can see that after the break of the uptrend line, the price has been consolidating and supported by the neckline of the rounding top pattern.
I am neutral and a bit alert as there is a bearish rounding top pattern yet to break the neckline to trigger the selloff. If it is supported by the neckline, it could use the neckline as a base to challenge the previous high.
HOMERIZ needs to break above 0.98 to be bullish. Should it break down from the uptrend line (i.e. below 0.88), we will need to be alert.
If it breaks the neckline (i.e. 0.83), it will be very bearish.
Bullish Ranking Order
- LIIHEN (Very bullish)
- HEVEA (bullish)
- POHUAT (bullish)
- LATITUD (slightly bullish)
- HOMERIZ (neutral)
- FFHB (Bearish, stay out)
Do you spot any interesting pattern? Feel free to share them to bounce off some more trading / investing ideas.
Topics That You Do Not Want To Miss
How to determine the "bullishness" of the patterns- https://www.facebook.com/BursaSGXcandlestick/videos/378260995905662/
The Trade Management Technique You Need To Know - http://klse.i3investor.com/blogs/candlestick/114496.jsp
Best Way To Learn To Trade Without A Mentor - http://klse.i3investor.com/blogs/candlestick/113821.jsp
Entry Illustration - http://klse.i3investor.com/blogs/candlestick/113605.jsp
Stop Loss & Safe Trading - http://klse.i3investor.com/blogs/candlestick/113510.jsp
Position Sizing - http://klse.i3investor.com/blogs/candlestick/113061.jsp
Come Up With Trading Ideas & Turn Them Into Investing Ideas - http://klse.i3investor.com/blogs/candlestick/114110.jsp
Cheers,
Ming Jong
Get Update From ==> http://www.vipplatform.com/lp/ideas/
& FB page ==> https://www.facebook.com/BursaSGXcandlestick/
Telegram Channel ==> https://t.me/BursaSGXCandlestick
Contact Via Email ==> ![]()
More articles on Candlestick & Breakout Patterns
IQGROUP Rounding Bottom Breakout With A Beautiful Uptrending Channel
Created by Ming Jong Tey | Jun 29, 2017
RCECAP Rounding Bottom Breakout Plus Trending Up Inside A Channel
Created by Ming Jong Tey | May 25, 2017
PENTA Revisit - Rounding Bottom Breakout In A Long-Term Time Frame
Created by Ming Jong Tey | May 21, 2017
Discussions
5 people like this. Showing 15 of 15 comments
I vote for liihen..
They earn the most, give highest dividends..
Most stable among all in such unstable market time..
2017-01-06 03:46
Good thing is loser evergreen is not in the list because it has highest debts among all makers and worst is that it is strapped with a whopping RM 216.585m debts! Can buy all others but avoid Evergreen at all cost!
2017-01-19 09:19
MJ, a few things have changed in the month of Jan.
Specifically, FFHB has broken upwards from the downtrend resistance line. Is it a good time now?
2017-02-02 18:56
@cephasyu, FFHB is hitting the inflection point now. For a bull case, I would like to see a breakout from those two down trend lines. Refer to this updated chart https://www.facebook.com/BursaSGXcandlestick/posts/303726780025751:0
2017-02-02 22:29
Those losers came out and shout when share price up little bit but remain quiet when down. Typical losers attitude detected. Ha ha!!
2017-02-06 12:10
Look at the trend when u invest or hold the stocks. NEVER hold onto downtrend stocks. These losers get stuck in Evergreen and the only thing they can do is talk good on it. Nothing more or spectacular. Boring same old hopeful waiting game. Ha ha!!
2017-02-06 12:11
Post a Comment
Featured Posts


Latest Videos


Apps


Top Articles
2
save malaysia!
3
BFM Podcast
4
BFM Podcast
5
BFM Podcast
6
BFM Podcast
7
BFM Podcast
8
BFM Podcast
#
Stock
Score
Daily Stocks
Stock Name
Last
Change
Volume
Stock Name
Last
Change
Volume
Stock Name
Last
Change
Volume
MQ Trading Signals
Stock
Time
Signal
Duration
No trading signals available.
Stock
Time
Signal
Duration
No trading signals available.
Featured Advertisers / Partners


Ride The Bull Short The Bear
CS Tan
4.9 / 5.0
This book is the result of the author's many years of experience and observation throughout his 26 years in the stockbroking industry. It was written for general public to learn to invest based on facts and not on fantasies or hearsay....
eagle71
Homeritz is troubled with shortage of workers.
Hevea lacks of significant growth catalyst.
Latitude is indeed undervalued, it's PE is the lowest and selling < NTA albeit ROE is in double digit. It's low dividend and low liquidity do not help.
I think Pohuat is a good choice. It is good to have operation out of Malaysia, i.e. Vietnam, in view of the worker shortage and increasing min wages problems in Malaysia.
2017-01-01 17:28