


Candlestick & Breakout Patterns
Game Over For AIRASIA or A Silver Lining Ahead? Let's Find Out From This Pattern

Ming Jong Tey
Publish date: Thu, 05 Jan 2017, 04:46 PM
Ming Jong Tey
0 68
Understand the psychology behind the candlestick & breakout pattern will give you an edge to realize why the market does what it does and anticipate opportunities before they happen!
Get notified on The Next Best Trading & Investing Ideas for free:
Visit ==> http://www.vipplatform.com/lp/ideas/
"Like" FB Page ==> https://www.facebook.com/BursaSGXcandlestick/
"Join" Telegram Channel ==> https://t.me/BursaSGXCandlestick
Get notified on The Next Best Trading & Investing Ideas for free:
Visit ==> http://www.vipplatform.com/lp/ideas/
"Like" FB Page ==> https://www.facebook.com/BursaSGXcandlestick/
"Join" Telegram Channel ==> https://t.me/BursaSGXCandlestick
Here is my response to a reader on AIRASIA, purely based on technical analysis.
Let's take a look at the weekly chart below:
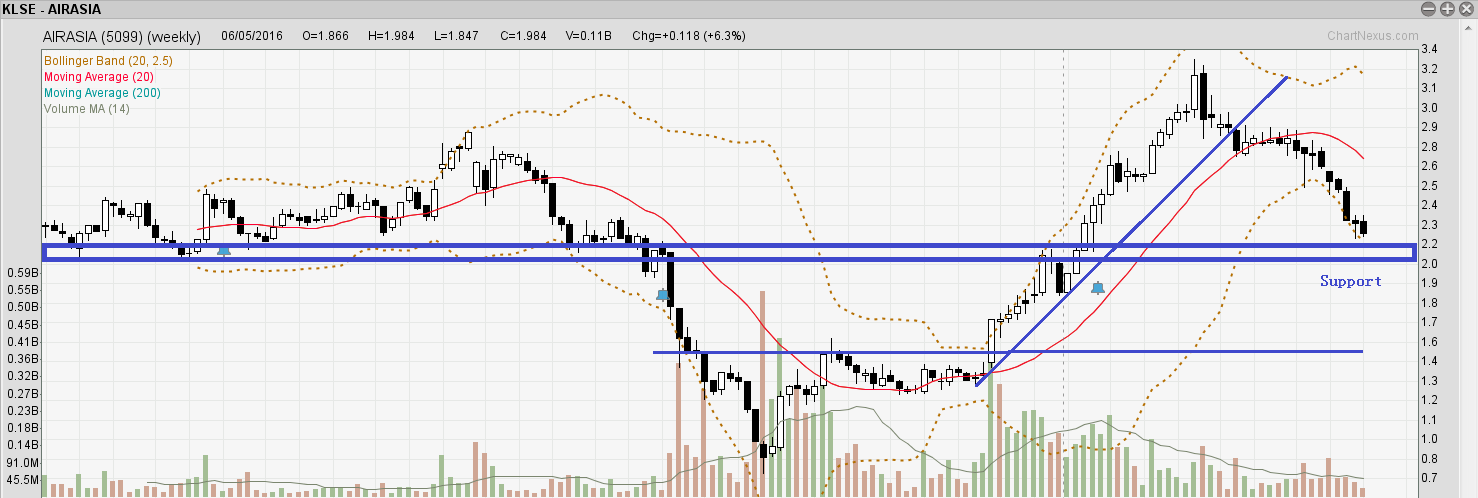
AIRASIA has been facing selling pressure after breaking out from the uptrend line. The first line of support is 2.1 as indicated in the blue box area.
As shown in the daily chart above, there is an inner trendline, which is touched 3 times as highlighted in the blue circled area. It is worth to note that the inner trendline also coincides with the horizontal support line of 2.1.
So the 4th blue circled area should form a strong support. I will expect AIRASIA to bounce from there. This will be the silver lining ahead.
Traders should look for candlestick reversal pattern at the support zone if you are betting on this silver lining. As it is a counter trend setup, a conservative position sizing approach would be more suitable.
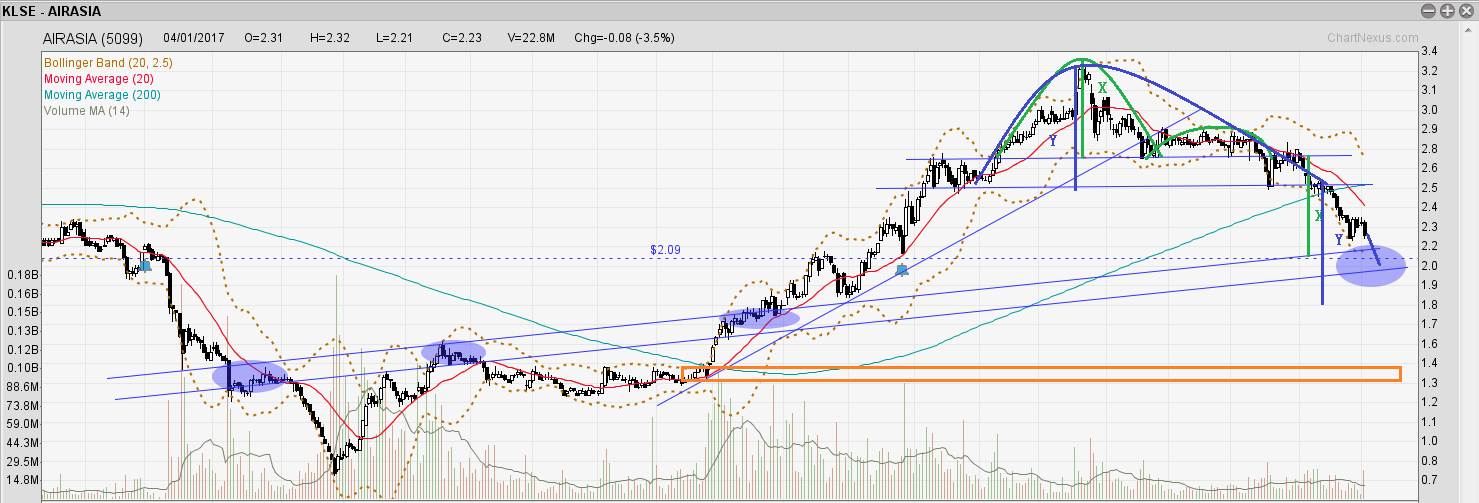
On the dark side, AIRASIA has broken down from an inverted cup and handle pattern as illustrated in green with a target price of 2.10, based on the projection of X. The target price coincides with the support zone.
However, there is another rounding top pattern as illustrated in blue, with a projection of Y, which will break the confluence support zone. Should it break the support zone, it may go back to test the orange support zone, which is around 1.3.
AIRASIA (5099): Bearish
Pattern Rounding top/Inverted Cup & Handle
I am bearish on AIRASIA as long as it does not break above 2.5-2.7 region. However, I expect a bounce from the support zone, 2.0-2.1.
Topics That You Do Not Want To Miss
How to determine the "bullishness" of the patterns- https://www.facebook.com/BursaSGXcandlestick/videos/378260995905662/
The Trade Management Technique You Need To Know - http://klse.i3investor.com/blogs/candlestick/114496.jsp
Best Way To Learn To Trade Without A Mentor - http://klse.i3investor.com/blogs/candlestick/113821.jsp
Entry Illustration - http://klse.i3investor.com/blogs/candlestick/113605.jsp
Stop Loss & Safe Trading - http://klse.i3investor.com/blogs/candlestick/113510.jsp
Position Sizing - http://klse.i3investor.com/blogs/candlestick/113061.jsp
Come Up With Trading Ideas & Turn Them Into Investing Ideas - http://klse.i3investor.com/blogs/candlestick/114110.jsp
Cheers,
Ming Jong
Get Update From ==> http://www.vipplatform.com/lp/ideas/
& FB page ==> https://www.facebook.com/BursaSGXcandlestick/
Telegram Channel ==> https://t.me/BursaSGXCandlestick
Contact Via Email ==> ![]()
More articles on Candlestick & Breakout Patterns
IQGROUP Rounding Bottom Breakout With A Beautiful Uptrending Channel
Created by Ming Jong Tey | Jun 29, 2017
RCECAP Rounding Bottom Breakout Plus Trending Up Inside A Channel
Created by Ming Jong Tey | May 25, 2017
PENTA Revisit - Rounding Bottom Breakout In A Long-Term Time Frame
Created by Ming Jong Tey | May 21, 2017
Discussions
1 person likes this. Showing 8 of 8 comments
dont go against the trend... is that one of the mantra in stock investing?
2017-01-05 17:23
@speakup From the chart wise, it is bearish. A potential bounce zone might worth to take a look if you want to buy...If you are doing value investing, the current sell-off could become a bargain for the value investor.
2017-01-05 18:09
hi ming .. enjoy reading all your postings ! very good sharing :) been following airasia .. counting her waves .. waiting patiently for a reversal trade !! i have a support zone between 2.12 and 1.89 .. in such a strong trend, do u merely use candlestick reversal at support to long ? say there is a bullish engulfing at your 2.1 support, do u buy at the next candle provided opening price is not lower ? or is it a better idea to wait for a break of structure on lower time-frame to confirm a possible counter-trend play ? many thanks
2017-01-05 18:28
Hi Connie, thanks for the comment. I like the demand zone at 1.90 but because it also breaks the inner trendline. I will be careful to trade a reversal at that zone as it could be merely a backtest to the inner trendline before going back down.
Ideally, I prefer to trade around 2.0-2.1 region, along with a hammer or bullish engulfing and strong volume to see the bullish momentum.
I prefer to trade at the next daily candle as my trading timeframe is daily. I haven't traded a break of structure in lower timeframe with Bursa stock. I do trade forex with the break of structure (i.e. a-b-c) method in the lower timeframe. Just a personal preference.
2017-01-05 21:26
Post a Comment
Featured Posts


Apps


Top Articles
1
TA Sector Research
BWYS Group Berhad - A Leading Sheet Metal and Scaffoldings Manufacturer
2
Kenanga Research & Investment
3
Kenanga Research & Investment
4
5
save malaysia!
6
TA Sector Research
7
8
#
Stock
Score
Daily Stocks
Stock Name
Last
Change
Volume
Stock Name
Last
Change
Volume
Stock Name
Last
Change
Volume
MQ Trading Signals
Stock
Time
Signal
Duration
Stock
Time
Signal
Duration
Featured Advertisers / Partners


Ride The Bull Short The Bear
CS Tan
4.9 / 5.0
This book is the result of the author's many years of experience and observation throughout his 26 years in the stockbroking industry. It was written for general public to learn to invest based on facts and not on fantasies or hearsay....
speakup
sifu icon say buy
u say sell
who to believe?
2017-01-05 17:16