


Candlestick & Breakout Patterns
SENDAI Strong Accumulation Phase Plus A Handle In The Making

Ming Jong Tey
Publish date: Mon, 16 Jan 2017, 05:44 PM
Ming Jong Tey
0 68
Understand the psychology behind the candlestick & breakout pattern will give you an edge to realize why the market does what it does and anticipate opportunities before they happen!
Get notified on The Next Best Trading & Investing Ideas for free:
Visit ==> http://www.vipplatform.com/lp/ideas/
"Like" FB Page ==> https://www.facebook.com/BursaSGXcandlestick/
"Join" Telegram Channel ==> https://t.me/BursaSGXCandlestick
Get notified on The Next Best Trading & Investing Ideas for free:
Visit ==> http://www.vipplatform.com/lp/ideas/
"Like" FB Page ==> https://www.facebook.com/BursaSGXcandlestick/
"Join" Telegram Channel ==> https://t.me/BursaSGXCandlestick
SENDAI (5205): Bullish
Pattern: Cup & Handle Pending Break Up & Breakout From Long-Term Downtrend Line
As shown in SENDAI's weekly chart below, the price broke out from the downtrend line with strong accumulation volume as circled in blue.
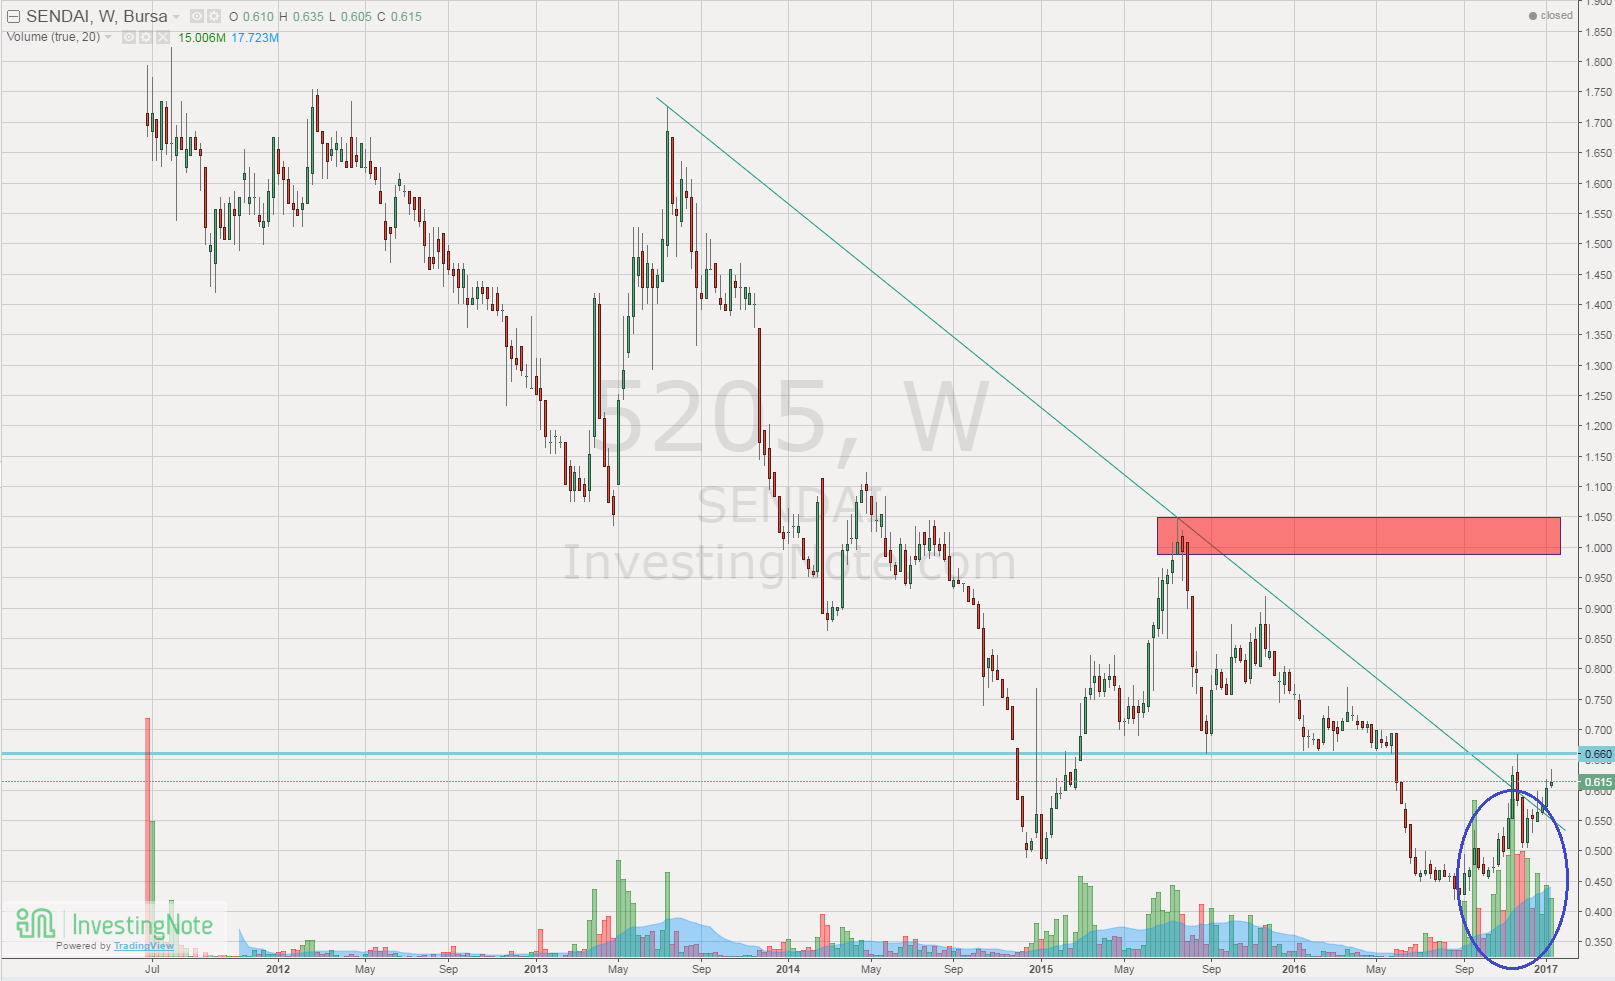
The first resistance will be the neckline at 0.65 and the second resistance will be the overhead as boxed in red, around 1.00.
Let's take a look at the daily chart below:
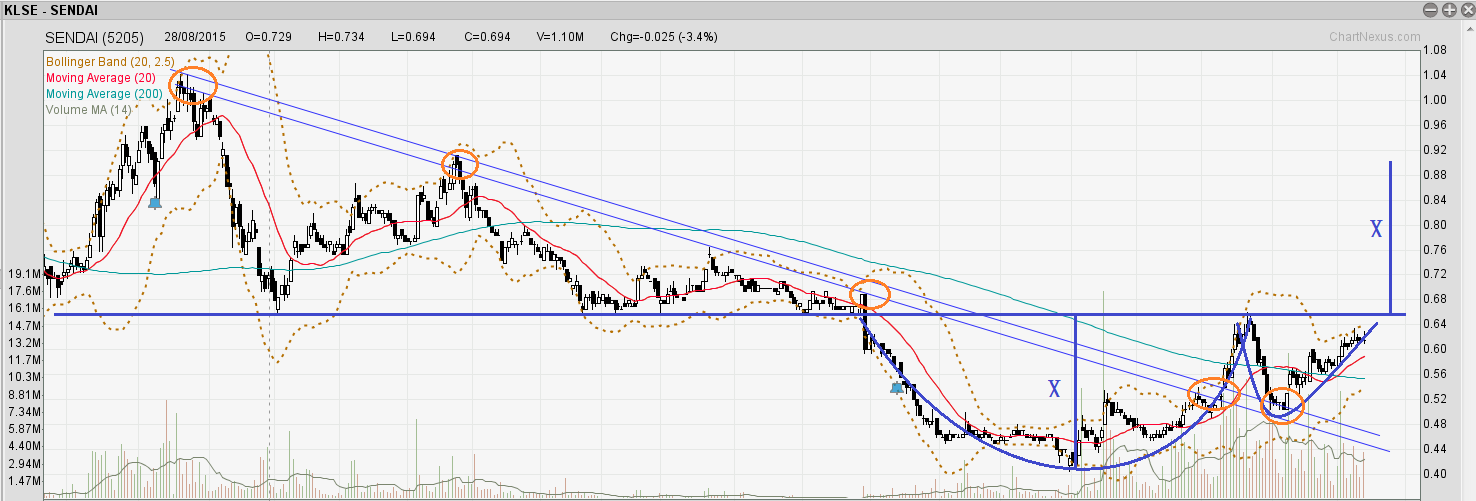
This is almost a textbook style cup and handle pattern.
We can see that after the broke down from a descending triangle, it built a base by forming the cup and handle pattern with significant volume.
During the formation of the cup, price broke out from the downtrend line and made a backtest as shown in the last orange circle. It is on its way to challenge the neckline.
Should it break the neckline, the immediate target price is 0.90. The second target price will be the 1.00, which is the overhead resistance as shown in the weekly chart above.
Topics That You Do Not Want To Miss
How to determine the "bullishness" of the patterns- https://www.facebook.com/BursaSGXcandlestick/videos/378260995905662/
The Trade Management Technique You Need To Know - http://klse.i3investor.com/blogs/candlestick/114496.jsp
Best Way To Learn To Trade Without A Mentor - http://klse.i3investor.com/blogs/candlestick/113821.jsp
Entry Setup Illustration - http://klse.i3investor.com/blogs/candlestick/113605.jsp
Stop Loss & Safe Trading - http://klse.i3investor.com/blogs/candlestick/113510.jsp
Position Sizing - http://klse.i3investor.com/blogs/candlestick/113061.jsp
Come Up With Trading Ideas & Turn Them Into Investing Ideas - http://klse.i3investor.com/blogs/candlestick/114110.jsp
Cheers,
Ming Jong
Get Update From ==> http://www.vipplatform.com/lp/ideas/
& FB page ==> https://www.facebook.com/BursaSGXcandlestick/
Telegram Channel ==> https://t.me/BursaSGXCandlestick
Contact Via Email ==> ![]()
More articles on Candlestick & Breakout Patterns
IQGROUP Rounding Bottom Breakout With A Beautiful Uptrending Channel
Created by Ming Jong Tey | Jun 29, 2017
RCECAP Rounding Bottom Breakout Plus Trending Up Inside A Channel
Created by Ming Jong Tey | May 25, 2017
PENTA Revisit - Rounding Bottom Breakout In A Long-Term Time Frame
Created by Ming Jong Tey | May 21, 2017
Discussions
2 people like this. Showing 10 of 10 comments
Upbar & downbar do not represent anything as they can be hidden buying or selling. Distribution usually happens at the top and accumulation at the bottom. Other hints to look for are patterns and structure.
2017-01-17 22:34
So, you define it as accumulation as the graph dive into bottom and it din create new low though the vol is high?
2017-01-18 09:33
This is the first step to suspect an accumulation but needs to confirm by looking at the structure and pattern. Sometimes, without looking at other hints, it could be another escape wave for big boys to unload.
2017-01-18 10:39
@cephasyu Absolutely! As stated in my last paragraph, "Should it break the neckline, the immediate target price is 0.90". Breakout is definitely a trigger :)
2017-01-31 22:38
Post a Comment
Featured Posts


Latest Videos


Apps


Top Articles
2
save malaysia!
3
BFM Podcast
4
BFM Podcast
5
BFM Podcast
6
BFM Podcast
7
BFM Podcast
8
MQ Market Updates
#
Stock
Score
Daily Stocks
Stock Name
Last
Change
Volume
Stock Name
Last
Change
Volume
Stock Name
Last
Change
Volume
MQ Trading Signals
Stock
Time
Signal
Duration
No trading signals available.
Stock
Time
Signal
Duration
No trading signals available.
Featured Advertisers / Partners


Ride The Bull Short The Bear
CS Tan
4.9 / 5.0
This book is the result of the author's many years of experience and observation throughout his 26 years in the stockbroking industry. It was written for general public to learn to invest based on facts and not on fantasies or hearsay....
andyhard
May I know how you define as accumulation from the volume of the weekly chart where there are upbars and downbars? Could it be distribution on high vol?
2017-01-17 19:36