


Candlestick & Breakout Patterns
HIAPTEK - Ascending Triangle Plus Cup & Handle Breaking Out In The Process (Long Term Chart Inside)

Ming Jong Tey
Publish date: Thu, 09 Mar 2017, 05:44 PM
Ming Jong Tey
0 68
Understand the psychology behind the candlestick & breakout pattern will give you an edge to realize why the market does what it does and anticipate opportunities before they happen!
Get notified on The Next Best Trading & Investing Ideas for free:
Visit ==> http://www.vipplatform.com/lp/ideas/
"Like" FB Page ==> https://www.facebook.com/BursaSGXcandlestick/
"Join" Telegram Channel ==> https://t.me/BursaSGXCandlestick
Get notified on The Next Best Trading & Investing Ideas for free:
Visit ==> http://www.vipplatform.com/lp/ideas/
"Like" FB Page ==> https://www.facebook.com/BursaSGXcandlestick/
"Join" Telegram Channel ==> https://t.me/BursaSGXCandlestick
HIAPTEK (5072): Bullish
Pattern: Triangle Plus Cup & Handle Breaking Out (Attempting to break the neckline)
Have a look at Hiaptek's weekly chart below:
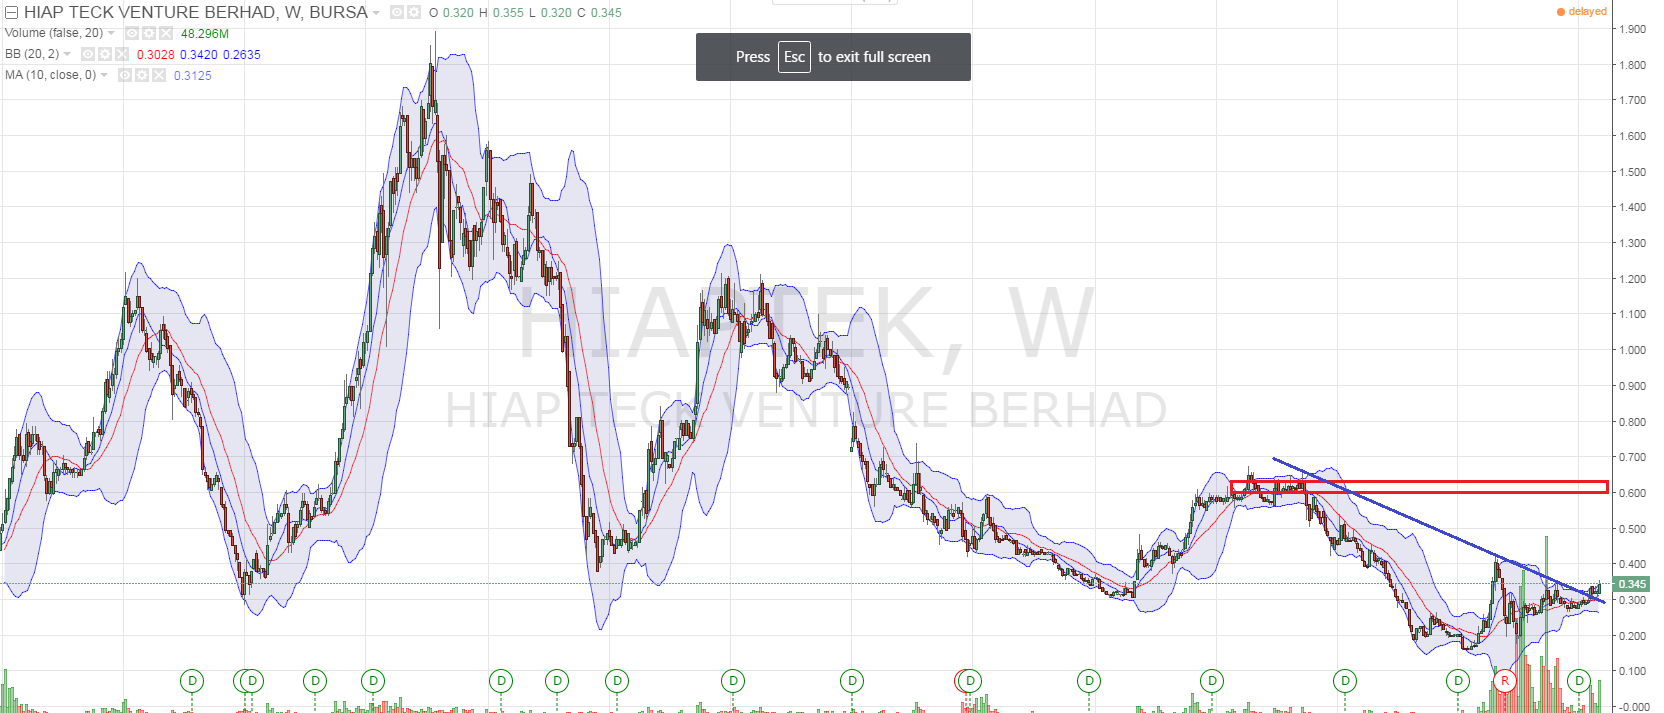
HIAPTEK recently broke out from the 2.5 year's downtrend line. The overhead resistance is boxed in red, which is around 0.60.
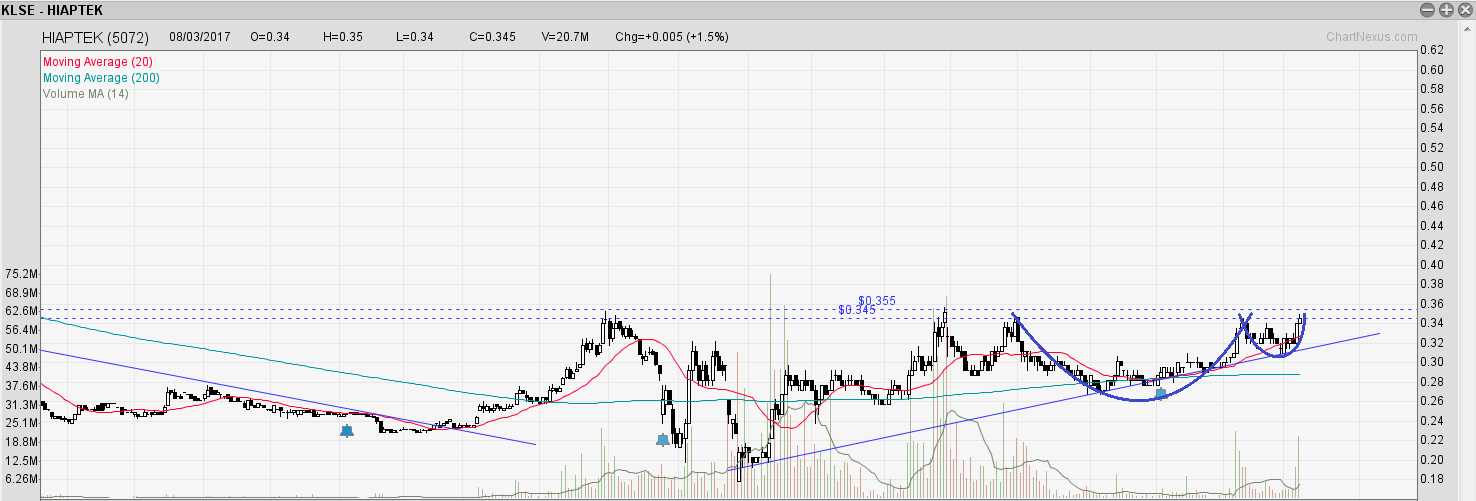
As shown in HIAPTEK's daily chart above, there is an ascending triangle together with a cup and handle formed since July 2016. It is currently attempting to break the neckline, which is 0.35.
Should it successfully break the neckline, the immediate target price (TP) will be 0.43, followed by 0.50 and 0.60 based on the pattern projection. It is worth to note the TP also coincides with the resistance (0.43 and 0.60).
Watch out for HIAPTEK's quarterly earning announcement, which is expected to be out by this month.
I am bullish on HIAPTEK as long as it is above 0.30.
Side note: Markets are generally in a correction/consolidation mode. Trade safe.
Leave me a comment below and let me know what you think. If you have any queries or want to share the next big stock with me, feel free to contact me via my email or FB page below.
Topics That You Do Not Want To Miss
How to determine the "bullishness" of the patterns- https://www.facebook.com/BursaSGXcandlestick/videos/378260995905662/
The Trade Management Technique You Need To Know - http://klse.i3investor.com/blogs/candlestick/114496.jsp
Best Way To Learn To Trade Without A Mentor - http://klse.i3investor.com/blogs/candlestick/113821.jsp
Entry Setup Illustration - http://klse.i3investor.com/blogs/candlestick/113605.jsp
Stop Loss & Safe Trading - http://klse.i3investor.com/blogs/candlestick/113510.jsp
Position Sizing - http://klse.i3investor.com/blogs/candlestick/113061.jsp
Come Up With Trading Ideas & Turn Them Into Investing Ideas - http://klse.i3investor.com/blogs/candlestick/114110.jsp
Cheers,
Ming Jong
Get Update From ==> http://www.vipplatform.com/lp/ideas/
& FB page ==> https://www.facebook.com/BursaSGXcandlestick/
Telegram Channel ==> https://t.me/BursaSGXCandlestick
Contact Via Email ==> ![]()
More articles on Candlestick & Breakout Patterns
IQGROUP Rounding Bottom Breakout With A Beautiful Uptrending Channel
Created by Ming Jong Tey | Jun 29, 2017
RCECAP Rounding Bottom Breakout Plus Trending Up Inside A Channel
Created by Ming Jong Tey | May 25, 2017
PENTA Revisit - Rounding Bottom Breakout In A Long-Term Time Frame
Created by Ming Jong Tey | May 21, 2017
Discussions
Be the first to like this. Showing 0 of 0 comments
Post a Comment
Featured Posts
New Update. Discover investment communities that resonate with your ideas

Apps


Top Articles
1
TA Sector Research
BWYS Group Berhad - A Leading Sheet Metal and Scaffoldings Manufacturer
2
Kenanga Research & Investment
3
4
Kenanga Research & Investment
5
save malaysia!
6
TA Sector Research
7
8
#
Stock
Score
Daily Stocks
Stock Name
Last
Change
Volume
Stock Name
Last
Change
Volume
Stock Name
Last
Change
Volume
MQ Trading Signals
Stock
Time
Signal
Duration
Stock
Time
Signal
Duration
Featured Advertisers / Partners


Ride The Bull Short The Bear
CS Tan
4.9 / 5.0
This book is the result of the author's many years of experience and observation throughout his 26 years in the stockbroking industry. It was written for general public to learn to invest based on facts and not on fantasies or hearsay....