


I have described the cost of capital as the Swiss Army knife of finance, a number that shows up in so many different places in corporate financial and analysis and valuation and in so many different contexts, that it is easy to mangle and misunderstand. In this post, my objective is simple. I will start with a description of the sequence that I use to get to a cost of capital for companies in January 2017, but the bulk of the post will be describing what the cost of capital looks like at the start of 2017 for companies around the world.
The Cost of Capital: Hurdle Rate, Opportunity Cost and Discount Rate
As I move from corporate finance to valuation to investment philosophies, the one number that seems to show up in almost every aspect of analysis is the cost of capital. In corporate finance, it is the hurdle rate that determines whether companies should make new investments, the optimizer for financing mix and the divining rod for how much to return to stockholders in dividends and buybacks. In valuation, it is the discount rate in discounted cash flow valuations and the determinants of enterprise value multiples (of EBITDA and sales).
It is perhaps because it is used in so many different contexts by such varied sub-groups that it remains a vastly misunderstood and misused number. If you are interested in reading more about the cost of capital, you may want to try this paper that I have on the topic (it is not technical or theoretical).
The Cost of Capital Calculation
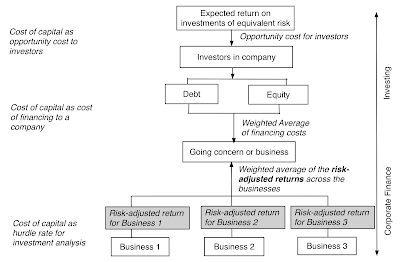
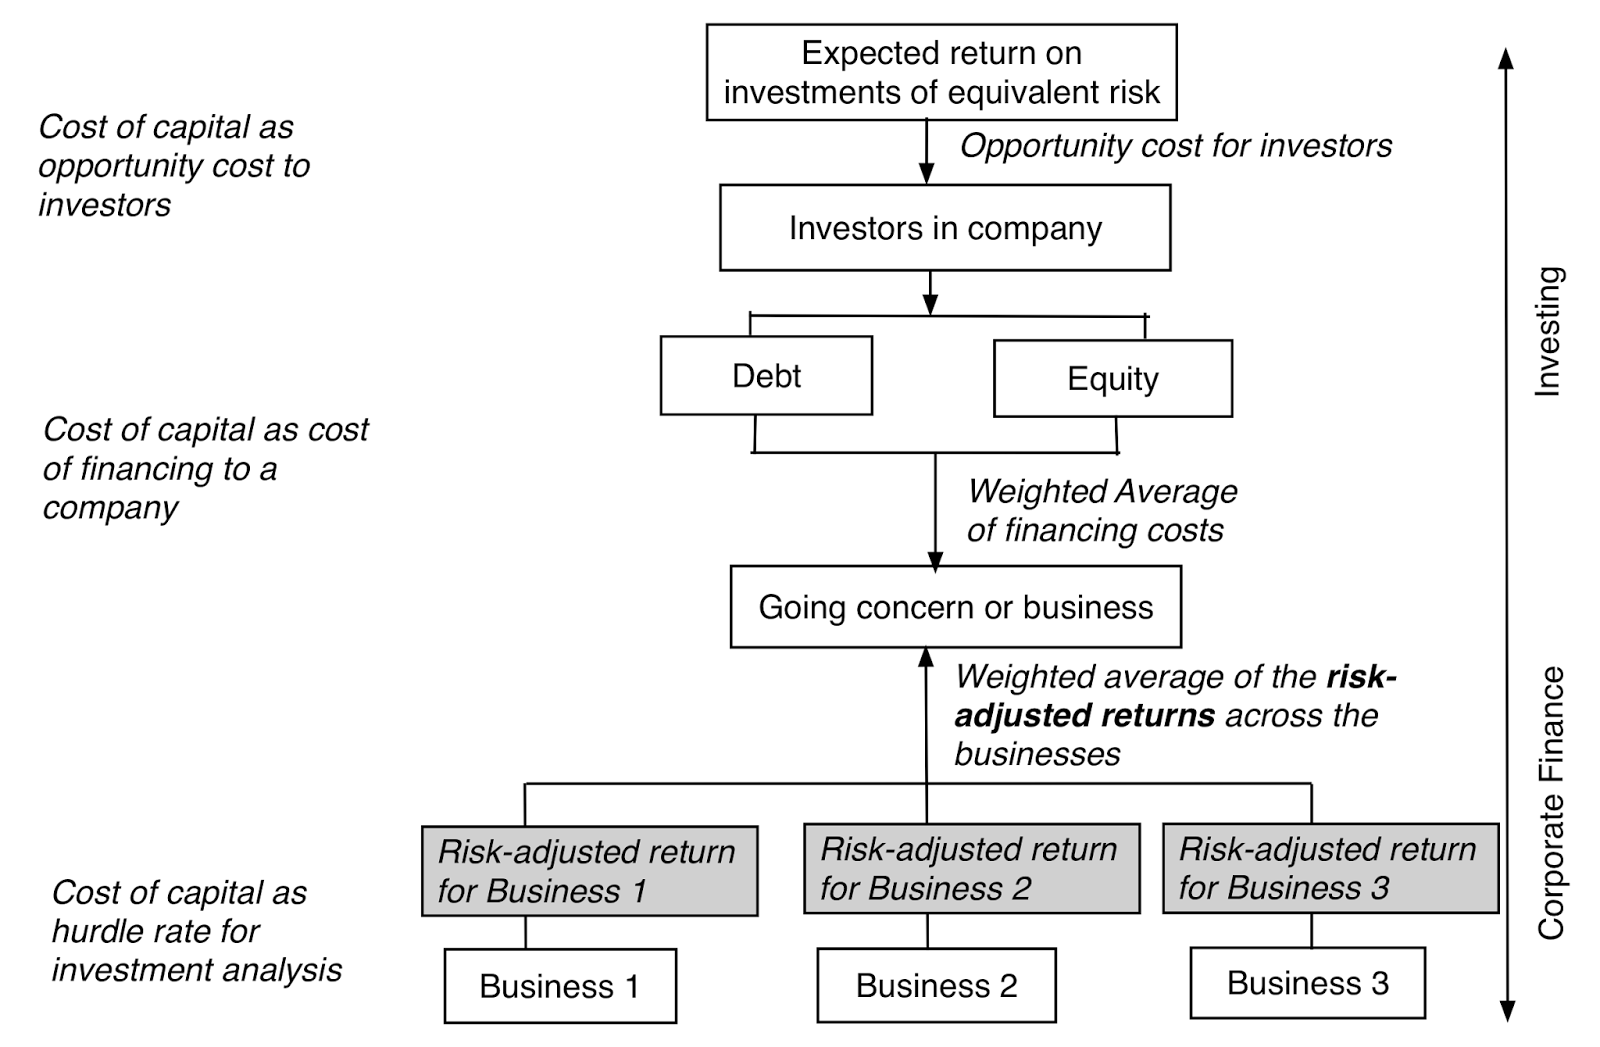
The cost of capital is the weighted average of the costs of equity and debt for a business. While entire books have been written on the measurement questions, I will keep it simple.
1. The cost of equity is the rate of return that the marginal investors, i.e., the investors who are most influential at setting your market price, are demanding to invest in equity in your business. To get to that number, you need three inputs, a risk free rate to get started, a measure of how risky your equity is, from the perspective of the marginal investors, and a price for taking that risk.
Cost of Equity = Risk Free Risk + Relative Risk Measure * Price of Risk
In the rarefied world of the capital asset pricing model, you assume that the marginal investor is diversified, beta measures relative risk and the equity risk premium is the price of risk, yielding a cost of equity.
2. The cost of debt is the rate at which you can borrow money, long term and today. It is not a historic cost of borrowing, nor can it be influenced by decisions on changing debt maturity. It can be computed by adding a credit or default spread to the risk free rate but it does come, in many markets, with a tax benefit which is captured by netting it out of your cost.
After-tax Cost of Debt = (Risk Free Rate + Default Spread) (1- Marginal Tax Rate)
The default spread can sometimes be observed, if the company issues long term bonds, sometimes easily estimated, if the company has a bond rating and you trust that rating, and sometimes requires more work, if you have to estimate default risk yourself.
3. The weights on debt and equity should be based upon market values, not book values, and can change over time, as your company changes.
Since I want to compute the cost of capital for every one of the 42,668 firms that comprised this year’s sample, I had to make some simplifying (and perhaps even simplistic) assumptions, some of which were necessitated by the size of my sample and some by data limitations. I have summarized them in the picture below.

I have computed the costs of capital for all companies in US dollar terms, not for parochial reasons, since converting to another currency is trivial (as I noted in my post on cracking the currency code) but to allow for consolidation and comparison.
The costs of capital that I compute for individual companies have two shortcomings, driven primarily by data limitations. The first is that the beta that I use for a company comes from the business that it is categorized in, rather than a weighted average of the multiple businesses that it may operate in. The second is that I have attached the equity risk premium of the country of incorporation rather than a weighted average of the ERPs of the countries in which a company operates; I had to do this since the revenue breakdowns by country were either not available for many companies or in too difficult a form to work with. If you want to compute the cost of capital for a company using my data, I have a spreadsheet that you can use that will let you break out of these bounds, allowing you to compute a beta across multiple businesses and an equity risk premium across many countries/regions.
The costs of capital that I compute for individual companies have two shortcomings, driven primarily by data limitations. The first is that the beta that I use for a company comes from the business that it is categorized in, rather than a weighted average of the multiple businesses that it may operate in. The second is that I have attached the equity risk premium of the country of incorporation rather than a weighted average of the ERPs of the countries in which a company operates; I had to do this since the revenue breakdowns by country were either not available for many companies or in too difficult a form to work with. If you want to compute the cost of capital for a company using my data, I have a spreadsheet that you can use that will let you break out of these bounds, allowing you to compute a beta across multiple businesses and an equity risk premium across many countries/regions.
Differences across Geographies
The first comparison I make is in the costs of capital across different countries and regions. The picture below shows cost of capital by country and you can download the data in a spreadsheet at this link.

Given that these are all US-dollar based costs of capital, the differences across countries can be attributed to four factors:
- Country risk: Country risk shows up in two places in the cost of capital calculation, the equity risk premium for the company (which is set equal to the equity risk premium of the country it is in) and an additional default spread in the cost of debt.
- Industry concentration: Since my measure of relative risk comes from looking at the global beta for the sector in which a company operates, the cost of capital for a country will reflect the breakdown of industries in that country. Thus, the cost of capital for Peru, a country with a disproportionately large number of natural resource companies, will reflect the beta of mining and natural resource companies.
- Marginal tax rate: To the extent that a higher marginal tax rate lowers the after-tax cost of debt, holding all else constant, countries with higher marginal tax rates will have lower after-tax costs of debt and perhaps lower costs of capital.
- Debt ratio: Twinned with the marginal tax rate, in computing how much a company is being helped by the tax benefit of debt, is the amount of debt that the company uses, with higher debt ratios often translating into lower costs of capital.
Differences across Industry Groups
I next turn to industry groupings and differences in cost of capital across them. In the table below, I list the ten (non-financial service) industry groupings globally, with the highest costs of capital, and the ten, with the lowest, at the start of 2017.

The reason for excluding financial service companies is simple. For banks, insurance companies and investment banks, the only hurdle rate that has relevance is a cost of equity, since debt is more raw material than a source of capital for these firms. You can download the entire industry list (with Global, European, Emerging Market and Australia/Canada worksheets) at this link, but again there are only a few reasons for the differences:
- Business risk: Some businesses are clearly more risky than others and I am using my sector betas to capture the differences in risk.
- Leverage differences: Companies in some sectors borrow more than others, with mixed effects on the cost of capital. The resulting higher debt to equity ratios push up sector betas more, leading to higher costs of equity. That, though, is more than partially offset by the benefit of raising financing at the after-tax cost of debt, a bargain relative to equity.
- Country exposure: Some industry groupings have geographic concentrations and to the extent that those concentrations are in countries with very low or very high risk, relative to the rest of the world, your cost of capital will be skewed low or high.
Distributional Perspective
I have long argued that analysts spend far too much time on tweaking and finessing costs of capital in valuation and not enough on estimating earnings and cash flows, and I base my argument on a very simple fact. The distribution of costs of capital for publicly traded companies is a tight one, with a large proportion of companies falling in a very narrow range. Rather than talk in abstractions, consider the histogram of costs of capital for US and global companies at the start of 2017:

The median US $ cost of capital for a US company is 7.22%, 50% of all US companies have costs of capital between 5.69% and 8.14%, and 80% have costs of capital between 4.59% and 8.87%. If you expand the distribution to include all global stocks, your distribution widens but not by as much as you might think. The median US $ cost of capital for a global company is 8.03%, half of all global companies have costs of capital between 6.88% and 9.15% and 90% of all companies globally have costs of capital between 5.63% and 10.68%. In other words, you don't have a lot of leeway to move your cost of capital for publicly traded firms. It is true that as you bring in other currencies into the mix, you can make the differences larger, but as I noted in my post on currencies, it is because of differences in inflation. You may want to pay heed to these distributions the next time that you see an analyst using a 20% US$ cost of capital to value a "risky" company or a 3% US$ cost of capital for a "safe" company, since neither number looks defensible, given the distribution.
Cost of Capital Maxims
I think that we not only spend too much time on estimating costs of capital in valuation but we also misunderstand what it is designed to measure. At the risk of repeating myself, here are four suggestions that I have on the cost of capital:
I think that we not only spend too much time on estimating costs of capital in valuation but we also misunderstand what it is designed to measure. At the risk of repeating myself, here are four suggestions that I have on the cost of capital:
- Don't make the cost of capital the receptacle of all your hopes and fears: Many analysts take to heart the principle that riskier firms should have higher costs of capital (or discount rates) but then proceed to intuit what that discount rate should be for company, given how risky they think it is. In the process, they often incorporate risks that don't belong in discount rates and attach prices for those risks that reflect their gut responses rather than what the market is paying.
- Focus on cash flows, not discount rates: When your valuations go awry, it is almost never because of the mistakes that you made on the discount rate and almost always because of errors in your estimates of cash flows (with growth, margins and reinvestment).
- Spend less time on estimating discount rates: It follows then that when you have a limited amount of time that you can spend on a valuation (and who does not?), that time is better spent on assessing cash flows than in fine tuning the discount rate.
- An approximation works well : When I am in a hurry to value a company, I use my distributional statistics (see graph above) to get started. Thus, if I am valuing an average risk company in US dollars, I will start off using an 8% cost of capital (the global median is 8.03%) and complete my valuation with that number, and if I still have time, I will come back and tweak the cost of capital. If it is very risky firm, I will start off with a 10.68% cost of capital (the 90th percentile) and gain revisit that number, if I have the time.
All in all, if your find yourself obsessing about the minutiae of discount rates in a valuation, it is perhaps because you want to avoid the big questions that make valuation interesting and challenging at the same time.
YouTube Video
Paper on the cost of capital
Spreadsheets
Datasets
Spreadsheets
Datasets
- Cost of Capital (US$), by Country - January 2017
- Cost of Capital (US$), by Industry - January 2017
- US $ Cost of Capital - Percentiles for US and Global companies
Data 2017 Posts
- Data Update 1: The Promise and Perils of Big Data
- Data Update 2: The Resilience of US Equities
- Data Update 3: Cracking the Currency Code - January 2017
- Data Update 4: Country Risk and Pricing, January 2017
- Data Update 5: A Taxing Year Ahead?
- Data Update 6: The Cost of Capital in January 2017
- Data Update 7: Profitability, Excess Returns and Corporate Governance- January 2017
- Data Update 8: The Debt Trade off in January 2017
- Data Update 9: Dividends and Buybacks in 2017
- Data Update 10: A Pricing Update in January 2017


