


Investment tricks
**基本图表分析**Technical Analysis: Some basic chart analysis

Charts are useful in terms of analyzing the strength and trends of a
certain stocks. However, this analysis can never and should never be
used as a sole factor to determine whether a stock is suitable to be
invested in. Every stock purchases must be done after both research
in terms of technical and fundamental has been made. Furthermore,
chart analysis can be correct most of the time but never all the time,
therefore it is necessary to include other type of analysis to farther
reduce the risk when investing.
Secondly, chart analysis is meant for short term trends and pattern
prediction, the longer the time, the more irrelevant it is. Therefore,
often case it can only be applied in period close to a certain period.
With that in mind, let’s look at some basic chart analysis:
1) The most popular and reliable pattern we can observe in charts is
the head and shoulder pattern (either upright or reversed).
a few important characteristic in head and shoulder:
Head: the highest point achieved in the middle peak.
Shoulders: the peak before of after the head which has lower peak
value compared to the head. Can have more than one for each side.
Neckline: the support for the period the pattern occurs.
Head and shoulders usually points to CHANGE IN MOMENTUM
(bullish momentum stops or bearish momentum stops)
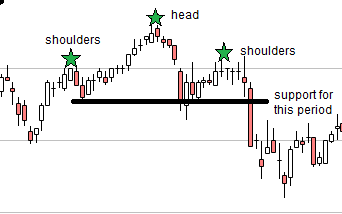
The chart attached is MAYBANK(1155) from July 2013 to August
2013. It shows a upright head and shoulder pattern. From the chart,
after it forms the shoulder after the head it is likely the bullish trend
will become weaker. The trend is further enforced when the price
breached the support line for the period. Therefore, at least in short
term of a few months we can assume the chances of creating new
height(compared to head) is very low.
2)double tops/bottoms (have the same analysis as triple tops or
bottoms)
Important characteristic:
chart pattern shows twice (or thrice) in a short period, stock price
attempts to break through a certain price or drop lower than a certain
price but always drops/ rebounds back.
Points to:
a) A strong resistance/support line. Price of the stock will not breach
the line in a short time except there is stronger news (super high
profits, new investors, company crisis)
b) Intermediate momentum REVERSAL The momentum has high
possibility to shift from bullish to bearish or vice versa. This is because
the confidence of investors have been enforced by either i) The stock
will not create higher peaks or ii) The stock will not fall below a level.
Hitting the same level a few times make the impact of reversing the
momentum stronger than head and shoulder.
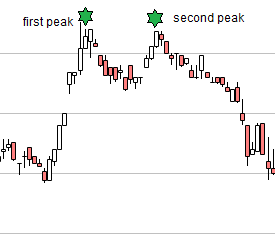
This is the chart for OSKPROP (6661) from August 2014 to September
2014. It shows the momentum reversal after failing to break throught
the same resistance 2 times in a row.
3) Triangle
Triangles consist of charts which shows a converging price to a single
point, until the triangle is broken by an abrupt drop/rise with a
substancial amount.
The drop or rise points to the likely trend to follow.
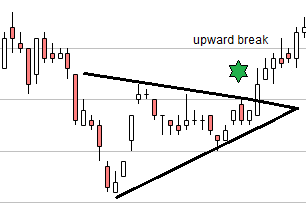
The following shows an example of upward breaking triangle. SYSTECH
(0050) from December 2014 to January 2015. The upward break in the
triangle points to the uptrend that follows.
The weakness of this pattern is most of the time a big change has
already happened before the prediction can be made from the graph.
4) Rounding- The long, slow and weak transition between bullish
and bearish momentums that shapes like a rounding edge.
Usually takes a very long time,
hence, is very difficult to analyze or predict. The length of time also
increases the chances for unexpected development. The lack of triggers
also make it a very difficult phase to trade stocks.
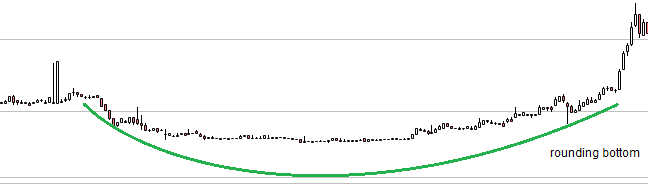
Graph shows LATITUD (7006) from Jul 2011 to Jan 2014. The trend
change or formation takes a long time with bottom rounding pattern.
Lastly, we still have to bear in mind chart analysis do enforce the
chances but ultimately, market does not act as it should every time.
Therefore, applying fundamental analysis together with technical
analysis is still very important.
Any comment is appreciated.
More articles on Investment tricks
Discussions
Be the first to like this. Showing 0 of 0 comments
Post a Comment
Featured Posts
Introducing MY's First IPO Fund for Sophisticated Investors!
New Update. Discover investment communities that resonate with your ideas
M & A Value Partners IPO Equity Fund has been launched - Targeted 13% Return p.a
Latest Videos


Apps


Top Articles
1
CEO Morning Brief
2
Good Articles to Share
3
Good Articles to Share
Jim Cramer talks companies investors should be cautious of in 2025
4
Good Articles to Share
Jim Cramer talks being cautious with nuclear power and quantum computing stocks
5
Good Articles to Share
6
Good Articles to Share
Newt Gingrich praises Mike Johnson for patience and calmness
7
Good Articles to Share
8
#
Stock
Score
Daily Stocks
Stock Name
Last
Change
Volume
Stock Name
Last
Change
Volume
Stock Name
Last
Change
Volume
MQ Trading Signals
Stock
Time
Signal
Duration
No trading signals available.
Stock
Time
Signal
Duration
No trading signals available.
Featured Advertisers / Partners


Ride The Bull Short The Bear
CS Tan
4.9 / 5.0
This book is the result of the author's many years of experience and observation throughout his 26 years in the stockbroking industry. It was written for general public to learn to invest based on facts and not on fantasies or hearsay....