Daily technical highlights – (FGV, INARI)
kiasutrader
Publish date: Thu, 04 Jun 2020, 08:50 AM
FGV (Not Rated)
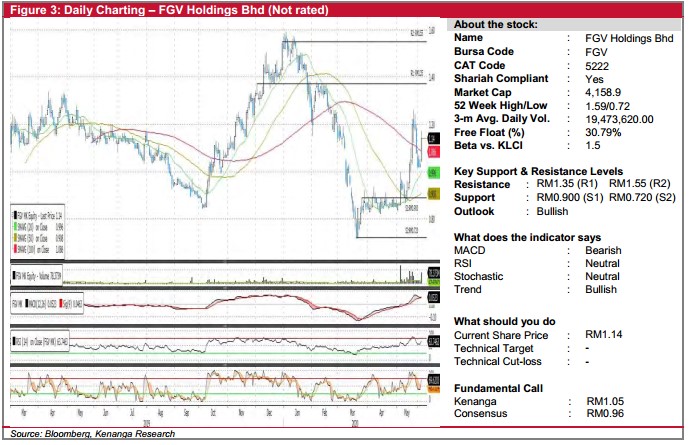
• FGV rose 12.0 sen (+11.76%) to close at RM1.14 yesterday.
• Chart-wise, the long white candlestick yesterday has prompted the stock to close above all of its key SMAs, on the back of
stronger-than average trading volume.
• Given the formation of a “Golden Cross” coupled with upticks from its key momentum indicators, we believe the stock may
trend higher.
• From here, overhead resistance levels are identified at RM1.35 (R1) and RM1.55 (R2).
• Conversely, support levels can be found at RM0.900 (S1) and RM0.720 (S2).
INARI (Not Rated)
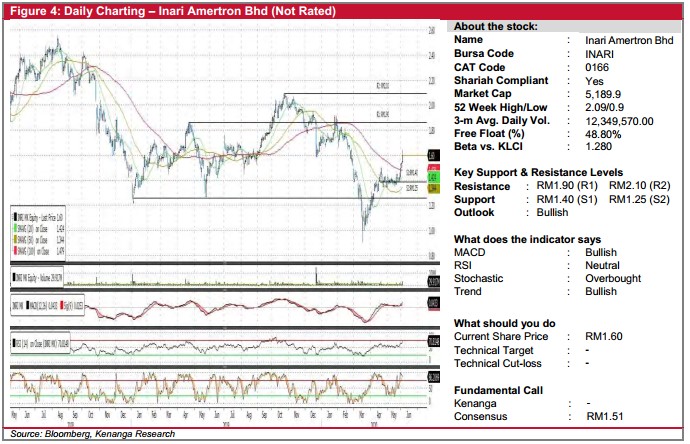
• INARI gained 7.0 sen (+4.58%) to close at RM1.60 yesterday.
• Chart-wise, the stock continued to close higher after breaking above all of its key SMAs a few days ago.
• Coupled with bullish signal from MACD indicator, we believe that there may be more room for upside.
• Should the bullish momentum persist, overhead resistance is seen at RM1.90 (R1) and RM2.10 (R2).
• Conversely, support levels can be identified at RM1.40 (S1) and RM1.25 (S2)
Related Stocks
| Chart | Stock Name | Last | Change | Volume |
|---|
More articles on Kenanga Research & Investment
Created by kiasutrader | Nov 25, 2024
Created by kiasutrader | Nov 25, 2024
Created by kiasutrader | Nov 25, 2024
Created by kiasutrader | Nov 25, 2024


