


Kenanga Research & Investment
Daily technical highlights – (CYPARK, SLVEST)

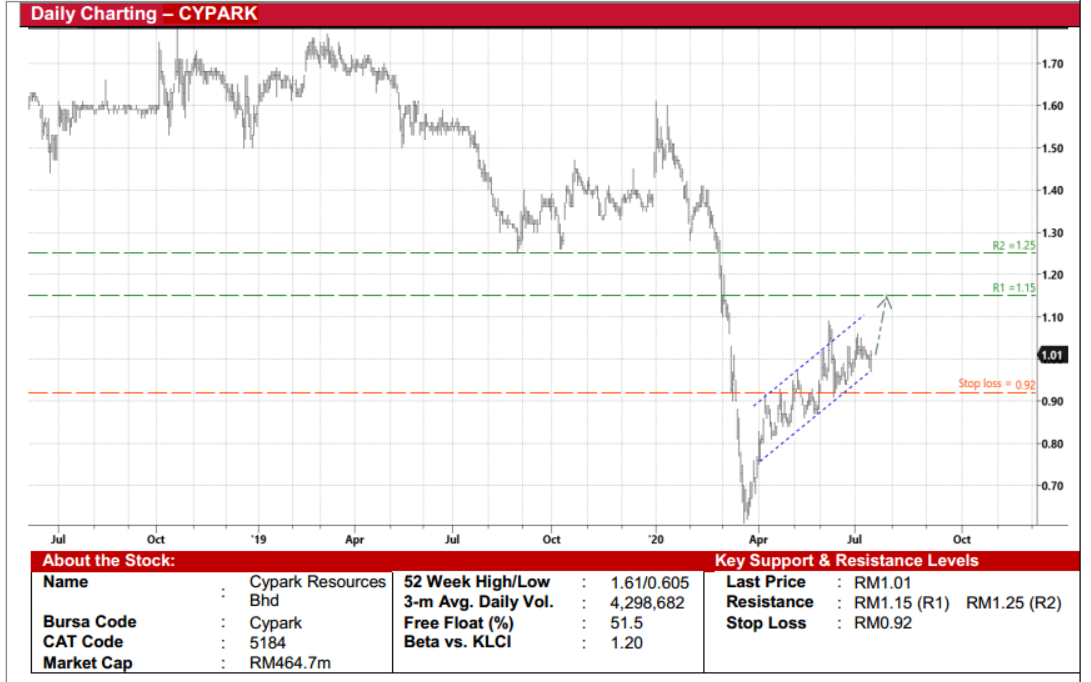
Cypark Resources Bhd (Trading Buy)
- CYPARK – which is engaged in the integrated renewable energy, green technology, environmental engineering and construction engineering businesses – is a proxy to the rising demand for green and sustainable energy solutions.
- On the chart, the stock has recovered from a low of RM0.61 on 19 March this year to close at RM1.01 yesterday.
- Currently trending within a positive sloping channel, CYPARK’s share price is expected to climb further to test our resistance thresholds of RM1.15 (R1) and RM1.25 (R2). This represents potential upsides of 14% and 24%, respectively.
- Our stop loss level is pegged at RM0.92 (or 9% downside risk).
- The Group posted a net profit of RM18.5m (-4.3% YoY) in 2QFY20, bringing its 1HFY20 earnings to RM33.1m (+2.2% YoY). Based on consensus full-year net profit estimate of RM80.6m, CYPARK is currently trading at an undemanding forward PER of 5.8x or almost 2SD below its 3-year historical mean.
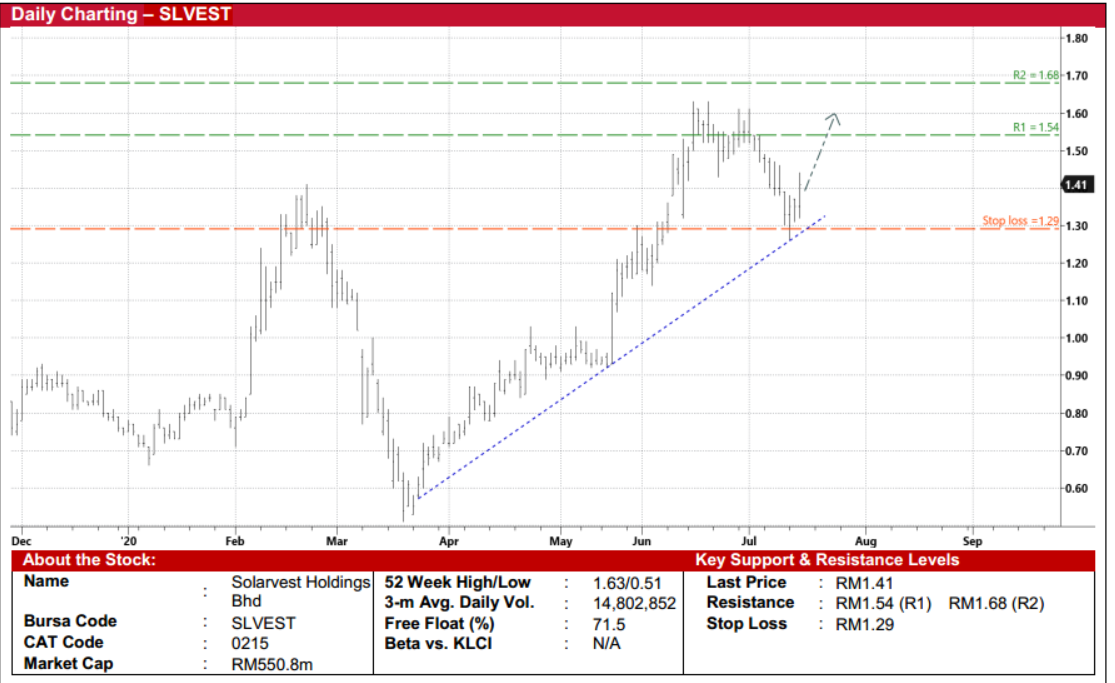
Solarvest Holdings Bhd (Trading Buy)
- SLVEST – which is principally a solar EPCC contractor specialising in solar photovoltaic (PV) systems – is in a position to tap on the fast-growing solar PV industry in Malaysia, as total solar PV installed capacity is targeted to increase from 438MW in 2018 to 3,322MW by 2023.
- On the chart, the stock has tested and subsequently bounced off from an upward sloping trendline earlier this week.
- And following yesterday’s 4.4% share price gain to close at RM1.41 amid heavy trading interest, the stock could be resuming its upward trajectory as SLVEST makes its way towards our resistance levels of RM1.54 (+9% potential upside) and RM1.68 (+19% potential upside).
- We have placed our stop loss level at RM1.29 (or 9% downside risk).
- Listed in November last year, this under-researched company made a net profit of RM3.8m in 4QFY20, taking its full-year FY March 2020 earnings to RM15.7m, which translates to a historical PER of 35.1x. The Group’s balance sheet is strong with cash & cash equivalents standing at RM50.1m (or 12.8 sen per share) as of end-March 2020.
Source: Kenanga Research - 16 Jul 2020
Related Stocks
| Chart | Stock Name | Last | Change | Volume |
|---|
Market Buzz
2024-11-25
SLVEST2024-11-25
SLVEST2024-11-25
SLVEST2024-11-25
SLVEST2024-11-25
SLVEST2024-11-25
SLVEST2024-11-25
SLVEST2024-11-23
SLVEST2024-11-22
SLVEST2024-11-22
SLVEST2024-11-21
SLVEST2024-11-20
SLVEST2024-11-19
CYPARK2024-11-19
SLVEST2024-11-18
CYPARK2024-11-18
SLVEST2024-11-14
CYPARKMore articles on Kenanga Research & Investment
Actionable Technical Highlights - PRESS METAL ALUMINIUM HLDG BHD (PMETAL)
Created by kiasutrader | Nov 25, 2024
Actionable Technical Highlights - PETRONAS CHEMICALS GROUP BHD (PCHEM)
Created by kiasutrader | Nov 25, 2024
Weekly Technical Highlights – Dow Jones Industrial Average (DJIA)
Created by kiasutrader | Nov 25, 2024
Malaysia Consumer Price Index - Edge up 1.9% in October amid food price surge
Created by kiasutrader | Nov 25, 2024
Discussions
Be the first to like this. Showing 0 of 0 comments
Post a Comment
Featured Posts
Introducing MY's First IPO Fund for Sophisticated Investors!
New Update. Discover investment communities that resonate with your ideas
M & A Value Partners IPO Equity Fund has been launched - Targeted 13% Return p.a
Latest Videos


Apps


Top Articles
1
2
3
Good Articles to Share
What’s behind the slew of restaurant bankruptcies in 2024? Experts unpack the problems
4
Good Articles to Share
5
Good Articles to Share
Four convicted in Spain over homophobic murder that sparked nationwode protests
6
Good Articles to Share
7
Good Articles to Share
#
Stock
Score
Daily Stocks
Stock Name
Last
Change
Volume
Stock Name
Last
Change
Volume
Stock Name
Last
Change
Volume
Featured Advertisers / Partners


Ride The Bull Short The Bear
CS Tan
4.9 / 5.0
This book is the result of the author's many years of experience and observation throughout his 26 years in the stockbroking industry. It was written for general public to learn to invest based on facts and not on fantasies or hearsay....