


Kenanga Research & Investment
Daily Charting – TOPGLOVE (Technical Buy)

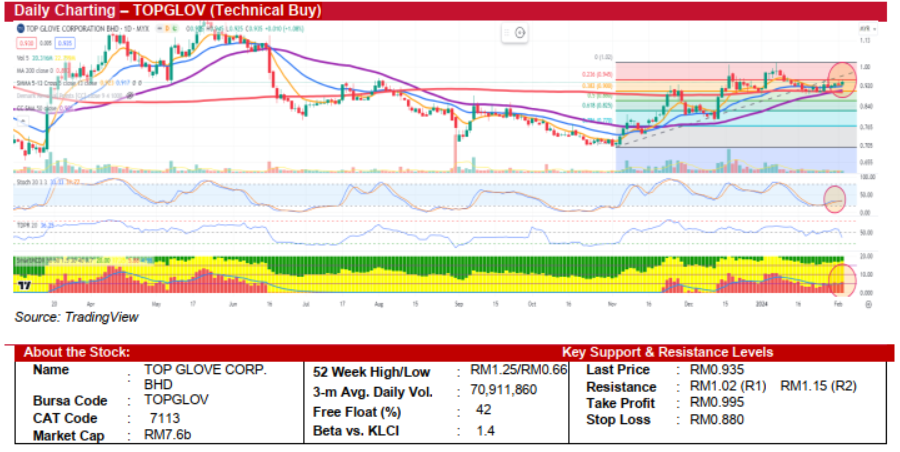
TOP GLOVE CORPORATION BERHAD (Technical Buy)
- After achieving a recent peak of RM1.02 on January 8, 2024, TOPGLOV began to retract and has been consolidating within the RM0.885 to RM0.945 range for the past two weeks. Despite this sideways consolidation, the recent crossover of the 50- day SMA above the 200-day SMA indicates a potentially brighter outlook. The convergence of the shorter-term SMAs, specifically the 5-day and 13-day, hints at an impending increase in volatility.
- From an indicator perspective, the stock’s Stochastic Oscillator has recovered from its near-term oversold levels and is trending upwards. Concurrently, the MCDX’s banker chips have surpassed the 14-day average line, suggesting that there could be a resurgence of buying interest soon.
- A decisive climb above the immediate resistance level of RM0.945 could propel TOPGLOV towards the higher resistance level of RM1.02. On the flip side, a breach below the lower boundary of the recent consolidation at RM0.885 may indicate a shift towards a bearish trend.
- We recommend initiating positions at RM0.935, targeting a profit-taking level at RM0.995, which presents a potential upside of approximately 6.4%. For risk mitigation, a stop-loss should be placed at RM0.880, capping the potential loss at roughly 5.9%.
Source: Kenanga Research - 6 Feb 2024
Related Stocks
| Chart | Stock Name | Last | Change | Volume |
|---|
Market Buzz
2024-12-26
TOPGLOV2024-12-26
TOPGLOV2024-12-26
TOPGLOV2024-12-26
TOPGLOV2024-12-24
TOPGLOV2024-12-24
TOPGLOV2024-12-23
TOPGLOV2024-12-23
TOPGLOV2024-12-23
TOPGLOV2024-12-23
TOPGLOV2024-12-23
TOPGLOV2024-12-23
TOPGLOV2024-12-23
TOPGLOV2024-12-23
TOPGLOV2024-12-23
TOPGLOV2024-12-23
TOPGLOV2024-12-20
TOPGLOV2024-12-20
TOPGLOV2024-12-19
TOPGLOV2024-12-16
TOPGLOVMore articles on Kenanga Research & Investment
Actionable Technical Highlights - RANHILL UTILITIES BHD (RANHILL)
Created by kiasutrader | Dec 23, 2024
Actionable Technical Highlights - HUP SENG INDUSTRIES BHD (HUPSENG)
Created by kiasutrader | Dec 23, 2024
Discussions
Be the first to like this. Showing 0 of 0 comments
Post a Comment
Featured Posts


Latest Videos


MQ Trading Signals
Time
Signal
Duration
Type
2024-12-26 16:10:00
EMA 5
5 Mins
SELL
2024-12-26 16:05:00
EMA 5
5 Mins
BUY
2024-12-26 15:55:00
EMA 5
5 Mins
SELL
2024-12-26 15:50:00
EMA 5
5 Mins
BUY
2024-12-26 15:45:00
EMA 5
5 Mins
SELL
Apps


Top Articles
1
Mercury Securities Research
2
3
4
THE INVESTMENT APPROACH OF CALVIN TAN
5
THE INVESTMENT APPROACH OF CALVIN TAN
6
Koon Yew Yin's Blog
7
M+ Online Research Articles
8
TA Sector Research
#
Stock
Score
Daily Stocks
Stock Name
Last
Change
Volume
Stock Name
Last
Change
Volume
Stock Name
Last
Change
Volume
Featured Advertisers / Partners


Ride The Bull Short The Bear
CS Tan
4.9 / 5.0
This book is the result of the author's many years of experience and observation throughout his 26 years in the stockbroking industry. It was written for general public to learn to invest based on facts and not on fantasies or hearsay....