JCY International (5161) - Watch for Triangle Breakout
MercurySec
Publish date: Tue, 17 Sep 2024, 09:32 AM

Technical Highlights
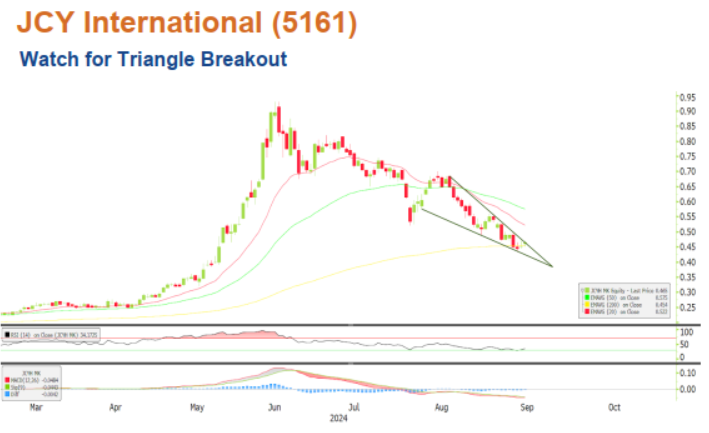
The stock is currently in a major downtrend, but there’s an opportunity forming. It’s now in the squeeze zone of a triangle pattern, which could lead to a breakout in the coming days. The stock is trading above the 200-day EMA which is encouraging, though it remains below the 20-day and 50-day EMAs. This combination signals that the stock is holding onto key long-term support, but still faces near-term resistance.
Momentum indicators show potential. While the MACD remains downward, it's been steady for a while, hinting at a potential golden cross formation if buying volume picks up. The RSI has also rebounded after reaching oversold levels and is now trending upward.
Given the strength of the 200-day EMA as support, a breakout could be near. An entry between RM0.455 and RM0.470 could be ideal, but for more cautious investors, entering after a confirmed breakout may be safer. The first resistance level to watch is RM0.525, followed by RM0.560, where heavy selling pressure is likely. On the downside, if the stock falls below RM0.420, the downtrend could continue.
Entry – RM0.455 – RM0.470
Stop Loss – RM0.425
Target Price – RM0.525 – RM0.560
Source: Mercury Research - 17 Sept 2024
Related Stocks
| Chart | Stock Name | Last | Change | Volume |
|---|
More articles on Mercury Securities Research
Created by MercurySec | Jan 22, 2025


