


RHB Retail Research
FKLI - Bouncing Off The 50-Day SMA Line

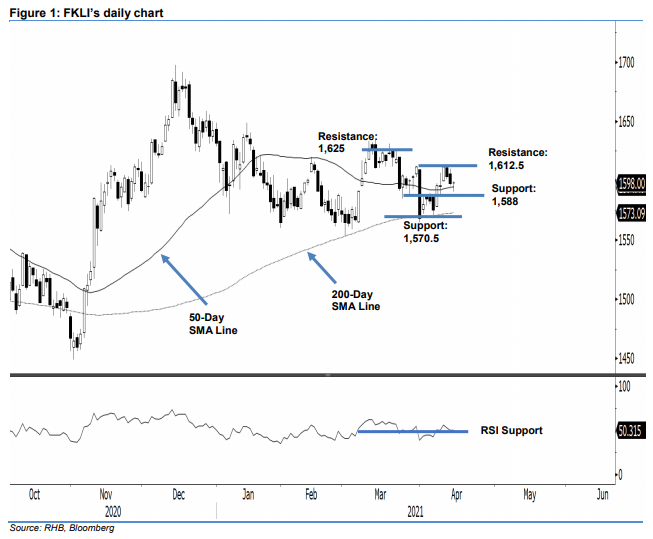
Maintain long positions. Bullish interest emerged near the 50-day SMA line yesterday, and the FKLI rose 0.50 pts to close at 1,598 pts. Following a bearish session on Tuesday, it opened at 1,598 pts, and dropped to touch the day’s low of 1,590.5 pts before reversing towards the day’s high of 1,599.5 pts. The index also formed a Dragonfly Doji pattern near the 50-day SMA line. The long lower shadow formation indicates that the bulls were accumulating near the day’s low, while selling pressure subsided. If the index stages a rebound in the coming sessions, the RSI indicator may curve higher – and buyers should gain strength to retest the immediate resistance of 1,612.50 pts. As long as it remains above 1,588 pts or stop-loss level, we make no change to our positive trading bias.
We suggest that traders stick to long positions, which were initiated at 1,596 pts, or the closing level of 7 Apr. To manage risks, the stop-loss is set below 1,588 pts.
The immediate support level remains at 1,588 pts, followed by 6 Apr’s low of 1,570.50 pts. Towards the upside, the immediate resistance is unchanged at 30 Mar’s high of 1,612.5 pt, followed by 1,625 pts.
Source: RHB Securities Research - 15 Apr 2021
More articles on RHB Retail Research
Duopharma Biotech - Lacking Near-Term Re-Rating Catalysts; D/G NEUTRAL
Created by rhboskres | Aug 26, 2024
Discussions
Be the first to like this. Showing 0 of 0 comments
Post a Comment
Featured Posts
Introducing MY's First IPO Fund for Sophisticated Investors!
New Update. Discover investment communities that resonate with your ideas
M & A Value Partners IPO Equity Fund has been launched - Targeted 13% Return p.a
Latest Videos


Apps


Top Articles
2
3
Koon Yew Yin's Blog
CPO price is rising rapidly as shown by chart below - Koon Yew Yin
4
Axcapital's investment blog
KAB - Executing its way to a record quarter. Could more Petronas contracts be coming?
5
Mercury Securities Research
6
BFM Podcast
7
8
BFM Podcast
#
Stock
Score
Daily Stocks
Stock Name
Last
Change
Volume
Stock Name
Last
Change
Volume
Stock Name
Last
Change
Volume
MQ Trading Signals
Stock
Time
Signal
Duration
No trading signals available.
Stock
Time
Signal
Duration
No trading signals available.
Featured Advertisers / Partners


Ride The Bull Short The Bear
CS Tan
4.9 / 5.0
This book is the result of the author's many years of experience and observation throughout his 26 years in the stockbroking industry. It was written for general public to learn to invest based on facts and not on fantasies or hearsay....