


Follow Kim's Stockwatch!
MY LAGGARD PLANTATION STOCK READY TO SKYROCKET!!!

LETS JOIN KIM'S STOCKWATCH GROUP?
Official Telegram : https://www.telegram.me/kimstock
Official Website : http://www.kimstockwatch.com/
Date : 25 March 2021
TSH RESOURCES BHD

The Profile
An investment holding company,is engaged in the marketing of cocoa beans, operation of oil palm plantations and forest management. It is involved in the operation of palm oil mills; manufacture and sale of crude palm oil and palm kernel; and generation and supply of electricity from a biomass plant.
The company is also engaged in the manufacture and sale of cocoa products, such as cocoa butter, cocoa cake, and cocoa powder; It is also involved in manufacture and sale of downstream wood products, supply and installation of timber flooring and timber strips panel flooring, sub-licensing of strip lock system for the manufacture of engineered solid hardwood flooring that uses mechanical locking systems, operation of a pulp plant. It also undertakes oil palm ramets and other tissue culture projects.
The company has operations in Malaysia, Spain, Luxembourg, France, the United States, Indonesia, and Singapore. TSH Resources Berhad was founded in 1979 and is based in Kuala Lumpur, Malaysia.
Kim's Target Price
Current Price - RM1.08
TP1: RM1.33 (immediate)
TP2: RM1.50
Warrant: TSH-CN
Current Price - 0.085 sen
TP1: 0.18 sen
TP2: 0.26 sen
The Time To Grow
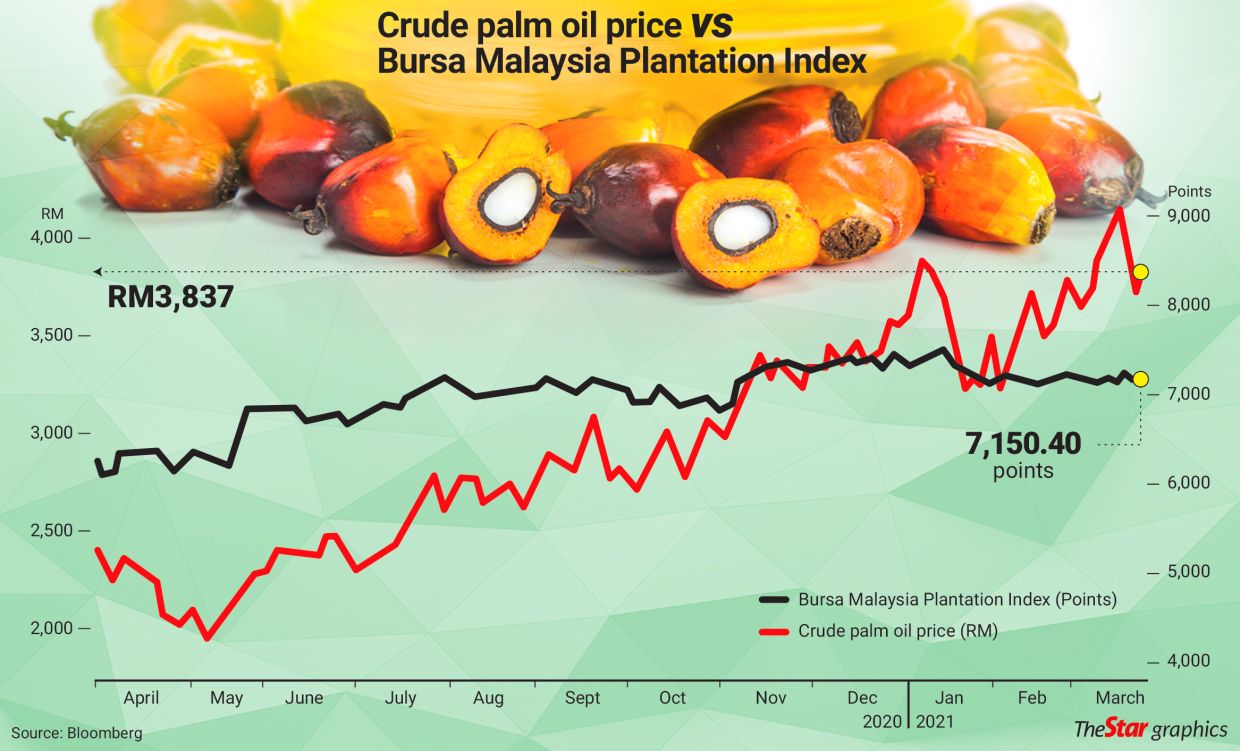
Market sentiment seems to lean towards the larger, more established palm oil companies as being the greatest beneficiaries of the crude palm oil rally.
But the phenomenon in the stock market is rather peculiar because their share prices begged to differ. In fact, the small cap palm oil companies were the ones that have outperformed the larger brethren, from when the market bottomed out on March 19 last year and between the period when the crude palm oil price (CPO) touched RM3,000 in September last year and when it hit its stratospheric price above RM4,000 per tonne last week.
The KeyNote
1. Industry palm production to increase in 2021F, driven mainly by Indonesia. Oil World has forecast global production of palm oil to increase by 4.0mil to 5.0mil tonnes in 2021F mainly due to Indonesia. Oil World estimates CPO output in Indonesia to improve by 8.2% to 45.4mil tonnes in 2021F from 42.0mil tonnes in 2020E. The Indonesia Palm Oil Association expects the country’s CPO output to rise by 4.3% to 49mil tonnes in 2021F from 47mil tonnes in 2020E. A recovery in FFB yields and ample rainfall would lead to higher industry palm production in Indonesia in 2021F.
2. Malaysia’s CPO production is expected inch up in 2021F. Currently, Oil World forecasts CPO production in Malaysia to rise to 19.5mil tonnes in 2021F from about 19.3mil tonnes in 2020E. The unexciting CPO output in 2021F is premised on the fact that there is a shortage of foreign labour in Malaysia presently. Also, the impact of a reduction in fertiliser application by smallholders in 2019 may still continue in 2021.
3. China’s demand for commodities has been robust in 2020E after the Covid-19 lockdown in Wuhan. China has been purchasing various soft commodities after the country ended its lockdown in Wuhan on 8 April 2020. Apart from stockpiling for the state reserves, the ramp-up in purchases was also due to China’s commitment to buy US$36.5bil worth of agricultural products from the US this year. China’s purchases of soybeans rose by 17.9% YoY to 11.16mil tonnes in 1H2020.
4. Indonesia biodiesel activities to pick up in 2021F. Indonesia’s biodiesel consumption is currently forecast to be 9.2mil KL (8.0mil tonnes) in 2021F compared with 8.0mil KL (6.97mil tonnes) in 2020E. The recovery in the biodiesel consumption in 2021F is expected to be driven by a pick-up in transportation activities in Indonesia following the ease of movement restrictions. As for B40, Indonesia has delayed implementing the biodiesel policy due to insufficient funds. B40 would have lifted Indonesia’s biodiesel consumption to 14.2mil KL (12.4mil tonnes) in 2022F. B40 trials were supposed to be completed in 2021F.
5. Malaysia is expected to complete the implementation of B20 biodiesel by mid-2021F. B20 is expected to increase Malaysia’s biodiesel consumption from 761,000 tonnes for B10 to 1.26mil tonnes for B20. The implementation of B7 in the industrial sector is estimated to absorb 100,000 tonnes of palm oil from the system. B20 was implemented in Sarawak in September 2020. B20 is expected to be implemented in Sabah in January 2021 and Peninsular Malaysia in June 2021.
6. The demand for downstream products would recover in 2H2021. As vaccines are gradually rolled out in 1H2021, the demand for non-healthcare oleochemical and refined palm products in the EU would recover in 2H2021. Also expect margin enhancements in 2H2021 as the cost of raw materials eased on higher palm supply.
7. Can be expect industry palm demand to recover in 2021F which is India’s imports of palm oil would revert to the normal level of 8.0mil to 9.0mil tonnes per year in 2021F vs. 6.0mil to 6.5mil tonnes in 2020E (2019: 9.3mil tonnes). Covid-19 had reduced India’s palm demand from the HORECA (hotels, restaurants and catering) segment in 2020E. HORECA accounts for about a third of India’s palm usage.
8. Can be expect China would continue restocking palm oil in 2021F. Hence, China’s palm imports may exceed 2020E’s level of about six million tonnes. In 2019, about 22.2% of palm oil were used in the oleochemical industry in China while another 20.8% were used by instant noodles companies. An additional 20.8% of palm oil were used by the catering industry in China while the balance 57.0% were used in the food processing, solid fats and biodiesel industries.
9. I believe output recovery will be partly offset by the Indonesian government’s commitment to its B30 biodiesel mandate in 2021, which will, in turn, support palm oil consumption, and low edible oil stockpiles among key producing countries and consuming countries.
10. As we know, Palm oil prices hit a 12 year high in January 2021 and have remained above the RM3,500 level boosted by stronger soybean oil prices and concerns about weak CPO production.
Barring unforeseen circumstances, the Group (TSH) is cautiously optimistic of achieving a
satisfactory performance for 2021.
11. The Board (TSH) remains optimistic on the long term prospect of the palm oil industry. Global
population and per capita income growth as well as the many health qualities of palm oil
are expected to drive greater demand for palm products. This augurs well for the Group (TSH) as
palm products segment which accounts for approximately 88% of the revenue for the Group
will remain the core contributor to the Group profit.
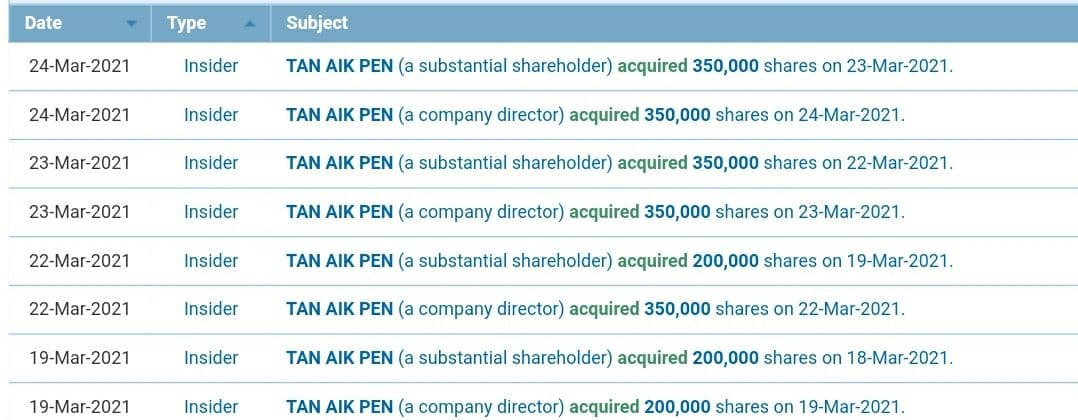
The Director Keep Buying
The Exports of All Palm Products
| PRODUCT | UNIT | JAN – FEB 2021 | JAN – FEB 2020 |
CHANGE (MT/ RM MIL) |
CHANGE (%) |
|---|---|---|---|---|---|
| CPO | Tonnes | 404,715 | 302,665 | 102,050 | 33.72 |
| RM Mil | 1,521.28 | 845 | 677 | 80.11 | |
| PPO | Tonnes | 1,438,380 | 2,000,433 | (562,053) | (28.10) |
| RM Mil | 5,249.85 | 5,860 | (610) | (10.41) | |
| PALM OIL | Tonnes | 1,843,095 | 2,303,098 | (460,003) | (19.97) |
| RM Mil | 6,771.13 | 6,705 | 67 | 0.99 | |
| CPKO | Tonnes | 30,110 | 44,597 | (14,487) | (32.48) |
| RM Mil | 149.92 | 159 | (10) | (5.97) | |
| PPKO | Tonnes | 103,604 | 126,678 | (23,074) | (18.21) |
| RM Mil | 522.97 | 482 | 41 | 8.51 | |
| PALM KERNEL OIL | Tonnes | 133,714 | 171,276 | (37,562) | (21.93) |
| RM Mil | 672.89 | 641 | 31 | 4.91 | |
| PALM KERNEL CAKE | Tonnes | 317,439 | 301,096 | 16,343 | 5.43 |
| RM Mil | 211.61 | 145 | 67 | 46.40 | |
| OLEOCHEMICALS | Tonnes | 500,806 | 498,776 | 2,030 | 0.41 |
| RM Mil | 2,483.62 | 2,001 | 482 | 24.09 | |
| FINISHED PRODUCTS | Tonnes | 96,776 | 82,602 | 14,174 | 17.16 |
| RM Mil | 479.11 | 378 | 101 | 26.80 | |
| BIODIESEL | Tonnes | 38,288 | 80,314 | (42,026) | (52.33) |
| RM Mil | 159.95 | 242 | (82) | (33.79) | |
| OTHERS | Tonnes | 197,677 | 242,236 | (44,559) | (18.39) |
| RM Mil | 271.37 | 221 | 51 | 22.86 | |
| TOTAL | Tonnes | 3,127,794 | 3,679,398 | (551,604) | (14.99) |
| RM Mil | 11,049.68 | 10,332 | 717 | 6.94 |
The Malaysia’s Exports & Imports
| Exports | Imports | |||
|---|---|---|---|---|
| 2021 | 2020 | 2021 | 2020 | |
| Jan | 947,539 | 1,213,569 | 165,198 | 85,033 |
| Feb | 895,556 | 1,089,529 | 87,326 | 66,735 |
| Mar | 1,184,973 | 79,216 | ||
| Apr | 1,236,478 | 56,596 | ||
| May | 1,369,351 | 37,101 | ||
| Jun | 1,706,635 | 48,841 | ||
| Jul | 1,783,284 | 52,691 | ||
| Aug | 1,578,075 | 32,311 | ||
| Sep | 1,612,155 | 48,273 | ||
| Oct | 1,674,380 | 45,398 | ||
| Nov | 1,303,807 | 112,663 | ||
| Dec | 1,642,835 | 282,058 | ||
| Jan-Dec | 17,395,071 | 946,917 | ||
The Exports to Major Countries
| COUNTRY | JAN – FEB 2021 | JAN – FEB 2020 | CHANGE (MT) | CHANGE (%) | JAN – DEC 2020 |
|---|---|---|---|---|---|
| INDIA | 284,404 | 68,006 | 216,398 | 318.20 | 2,726,956 |
| CHINA | 197,599 | 333,635 | (136,036) | (40.77) | 2,730,660 |
| NETHERLANDS | 126,564 | 188,716 | (62,152) | (32.93) | 1,072,952 |
| PHILIPPINES | 88,792 | 130,230 | (41,438) | (31.82) | 693,026 |
| JAPAN | 77,053 | 82,606 | (5,553) | (6.72) | 433,022 |
| IRAN | 72,440 | 7,744 | 64,696 | 835.43 | 321,041 |
| TURKEY | 70,855 | 95,600 | (24,745) | (25.88) | 615,872 |
| U.S.A | 65,579 | 112,382 | (46,803) | (41.65) | 540,349 |
| PAKISTAN | 64,266 | 217,849 | (153,583) | (70.50) | 1,003,723 |
| SAUDI ARABIA | 55,230 | 85,938 | (30,708) | (35.73) | 349,489 |
| TOTAL | 1,102,782 | 1,322,706 | (219,924) | (16.63) | 10,487,090 |
The Production & Stocks
| Production | End-Stocks | |||
|---|---|---|---|---|
| 2021 | 2020 | 2021 | 2020 | |
| Jan | 1,126,457 | 1,171,534 | 1,324,626 | 1,755,417 |
| Feb | 1,105,590 | 1,288,515 | 1,300,808 | 1,700,261 |
| Mar | 1,401,481 | 1,729,592 | ||
| Apr | 1,652,771 | 2,044,498 | ||
| May | 1,651,336 | 2,029,579 | ||
| Jun | 1,885,742 | 1,898,372 | ||
| Jul | 1,807,397 | 1,699,171 | ||
| Aug | 1,863,309 | 1,702,809 | ||
| Sep | 1,869,256 | 1,721,802 | ||
| Oct | 1,724,559 | 1,573,389 | ||
| Nov | 1,491,074 | 1,562,317 | ||
| Dec | 1,333,639 | 1,265,698 | ||
| *Jan-Dec | 1,595,051 | 1,723,575 | ||
The Monthly Average Prices
| 2021 | 2020 | |
|---|---|---|
| Jan | 3,749 | 3,014 |
| Feb | 3,896 | 2,715 |
| Mar | 2,382 | |
| Apr | 2,299 | |
| May | 2,074 | |
| Jun | 2,412 | |
| Jul | 2,519 | |
| Aug | 2,815 | |
| Sep | 2,924 | |
| Oct | 2,980 | |
| Nov | 3,422 | |
| Dec | 3,621 | |
| *Jan-Dec | 2,765 |
The Malaysian Palm Oil Exports Countries
| COUNTRY | JAN – FEB 2021 | JAN – FEB 2020 | CHANGE (MT) | CHANGE (%) | JAN – DEC 2020 |
|---|---|---|---|---|---|
| AFGHANISTAN | 11,997 | 12,102 | (105) | (0.87) | 75,740 |
| ALBANIA | 19 | 254 | (235) | (92.52) | 1,599 |
| ALGERIA | 3,567 | 5,909 | (2,342) | (39.63) | 17,016 |
| ANGOLA | 13,773 | 13,721 | 52 | 0.38 | 124,017 |
| ANTIGUA | 22 | 0 | 22 | #DIV/0! | 131 |
| ARGENTINA | 427 | 342 | 85 | 24.85 | 2,560 |
| AUSTRALIA | 24,960 | 21,890 | 3,070 | 14.02 | 145,978 |
| BAHRAIN | 1,579 | 2,491 | (912) | (36.61) | 9,758 |
| BANGLADESH | 19,768 | 22,790 | (3,022) | (13.26) | 315,275 |
| BARBADOS | 0 | 45 | (45) | (100.00) | 288 |
| BELGIUM | 1,023 | 473 | 550 | 116.28 | 3,174 |
| BENIN | 7,537 | 16,511 | (8,974) | (54.35) | 111,475 |
| BOSNIA AND HERZEGOVINA | 0 | 24 | (24) | (100.00) | 47 |
| BRAZIL | 768 | 774 | (6) | (0.78) | 9,141 |
| BRUNEI | 1,326 | 1,222 | 104 | 8.51 | 9,092 |
| BULGARIA | 47 | 2,485 | (2,438) | (98.11) | 10,706 |
| CAMBODIA | 124 | 737 | (613) | (83.18) | 2,142 |
| CAMEROON | 2,532 | 2,959 | (427) | (14.43) | 32,117 |
| CANADA | 2,933 | 2,275 | 658 | 28.92 | 12,905 |
| CENTRAL AFRICAN REPUBLIC | 0 | 60 | (60) | (100.00) | 203 |
| CHAD | 0 | 683 | (683) | (100.00) | 1,032 |
| CHILE | 655 | 2,014 | (1,359) | (67.48) | 8,764 |
| CHINA | 197,599 | 333,635 | (136,036) | (40.77) | 2,730,660 |
| COLOMBIA | 42 | 22 | 20 | 90.91 | 639 |
| COMOROS | 139 | 60 | 79 | 131.67 | 1,242 |
| CONGO, DEMOCRATIC REP. OF THE | 15,576 | 4,964 | 10,612 | 213.78 | 47,035 |
| COSTA RICA | 0 | 18 | (18) | (100.00) | 18 |
| COTE D’IVOIRE | 2,926 | 6,716 | (3,790) | (56.43) | 53,799 |
| CROATIA | 758 | 688 | 70 | 10.17 | 7,999 |
| CUBA | 143 | 143 | – | – | 618 |
| DENMARK | 7,241 | 7,695 | (454) | (5.90) | 52,832 |
| DJIBOUTI | 7,252 | 17,909 | (10,657) | (59.51) | 122,390 |
| DOMINICA | 1,787 | 21 | 1,766 | 8,409.52 | 527 |
| DOMINICAN REPUBLIC | 0 | 232 | (232) | (100.00) | 232 |
| EGYPT | 22,266 | 16,924 | 5,342 | 31.56 | 155,747 |
| ERITREA | 850 | 116 | 734 | 632.76 | 2,639 |
| ETHIOPIA | 1,218 | 1,267 | (49) | (3.87) | 20,080 |
| FIJI | 278 | 387 | (109) | (28.17) | 2,443 |
| FRANCE | 67 | 29 | 38 | 131.03 | 259 |
| GABON | 0 | 178 | (178) | (100.00) | 513 |
| GAMBIA | 2,029 | 2,892 | (863) | (29.84) | 19,752 |
| GEORGIA | 2,114 | 7,078 | (4,964) | (70.13) | 19,470 |
| GERMANY | 2,893 | 7,367 | (4,474) | (60.73) | 21,462 |
| GHANA | 29,422 | 32,689 | (3,267) | (9.99) | 246,861 |
| GREECE | 8,705 | 5,733 | 2,972 | 51.84 | 16,006 |
| GUATEMALA | 120 | 360 | (240) | (66.67) | 1,219 |
| GUINEA | 539 | 1,854 | (1,315) | (70.93) | 19,577 |
| GUYANA | 571 | 432 | 139 | 32.18 | 2,738 |
| HAITI | 1,001 | 1,618 | (617) | (38.13) | 12,743 |
| HONG KONG | 5,623 | 596 | 5,027 | 843.46 | 10,541 |
| HUNGARY | 0 | 238 | (238) | (100.00) | 1,451 |
| INDIA | 284,404 | 68,006 | 216,398 | 318.20 | 2,726,956 |
| INDONESIA | 695 | 9,170 | (8,475) | (92.42) | 19,101 |
| IRAN | 72,440 | 7,744 | 64,696 | 835.43 | 321,041 |
| IRAQ | 1,986 | 19,276 | (17,290) | (89.70) | 25,869 |
| ITALY | 25,465 | 61,469 | (36,004) | (58.57) | 439,053 |
| JAMAICA | 238 | 196 | 42 | 21.43 | 1,809 |
| JAPAN | 77,053 | 82,606 | (5,553) | (6.72) | 433,022 |
| JORDAN | 4,697 | 1,958 | 2,739 | 139.89 | 13,136 |
| KAZAKHSTAN | 485 | 3,091 | (2,606) | (84.31) | 16,066 |
| KENYA | 48,571 | 19,542 | 29,029 | 148.55 | 520,758 |
| KIRIBATI | 19 | 20 | (1) | (5.00) | 88 |
| KUWAIT | 5,480 | 6,060 | (580) | (9.57) | 20,449 |
| KYRGYZSTAN | 0 | 86 | (86) | (100.00) | 591 |
| LAOS | 58 | 42 | 16 | 38.10 | 248 |
| LATVIA | 0 | 128 | (128) | (100.00) | 1,794 |
| LEBANON | 1,276 | 1,978 | (702) | (35.49) | 7,675 |
| LIBERIA | 315 | 701 | (386) | (55.06) | 7,749 |
| LIBYA | 75 | 0 | 75 | #DIV/0! | 273 |
| LITHUANIA | 2 | 0 | 2 | #DIV/0! | 97 |
| MACEDONIA | 47 | 139 | (92) | (66.19) | 817 |
| MADAGASCAR | 16,786 | 13,964 | 2,822 | 20.21 | 101,058 |
| MALDIVES | 987 | 892 | 95 | 10.65 | 5,020 |
| MAURITANIA | 7,529 | 8,645 | (1,116) | (12.91) | 88,689 |
| MAURITIUS | 284 | 351 | (67) | (19.09) | 3,281 |
| MAYOTTE | 16 | 0 | 16 | #DIV/0! | 84 |
| MEXICO | 1,120 | 1,108 | 12 | 1.08 | 7,415 |
| MONGOLIA | 165 | 252 | (87) | (34.52) | 1,150 |
| MOROCCO | 376 | 4,306 | (3,930) | (91.27) | 18,613 |
| MOZAMBIQUE | 53,724 | 44,633 | 9,091 | 20.37 | 301,757 |
| MYANMAR | 3,906 | 9,789 | (5,883) | (60.10) | 40,978 |
| NAMIBIA | 45 | 307 | (262) | (85.34) | 972 |
| NEPAL | 573 | 1,013 | (440) | (43.44) | 2,420 |
| NETHERLANDS | 126,564 | 188,716 | (62,152) | (32.93) | 1,072,952 |
| NEW ZEALAND | 4,982 | 6,852 | (1,870) | (27.29) | 31,817 |
| NIGER | 0 | 6,605 | (6,605) | (100.00) | 18,688 |
| NIGERIA | 22,114 | 24,350 | (2,236) | (9.18) | 367,819 |
| NORWAY | 23 | 0 | 23 | #DIV/0! | 44 |
| OMAN | 6,536 | 2,789 | 3,747 | 134.35 | 99,911 |
| PAKISTAN | 64,266 | 217,849 | (153,583) | (70.50) | 1,003,723 |
| PALESTINE | 112 | 0 | 112 | #DIV/0! | 141 |
| PANAMA | 257 | 84 | 173 | 205.95 | 1,244 |
| PAPUA N GUINEA | 3,068 | 793 | 2,275 | 286.89 | 10,551 |
| PARAGUAY | 4 | 0 | 4 | #DIV/0! | #N/A |
| PERU | 0 | 240 | (240) | (100.00) | 675 |
| PHILIPPINES | 88,792 | 130,230 | (41,438) | (31.82) | 693,026 |
| POLAND | 0 | 105 | (105) | (100.00) | 516 |
| PORTUGAL | 13 | 5 | 8 | 160.00 | 328 |
| QATAR | 5,146 | 4,486 | 660 | 14.71 | 20,130 |
| ROMANIA | 661 | 1,337 | (676) | (50.56) | 6,559 |
| RUSSIA | 853 | 1,666 | (813) | (48.80) | 10,967 |
| SAUDI ARABIA | 55,230 | 85,938 | (30,708) | (35.73) | 349,489 |
| SENEGAL | 3,652 | 5,690 | (2,038) | (35.82) | 39,137 |
| SERBIA | 0 | 29 | (29) | (100.00) | 816 |
| SEYCHELLES | 23 | 67 | (44) | (65.67) | 361 |
| SIERRA LEONE | 0 | 1,472 | (1,472) | (100.00) | 4,631 |
| SINGAPORE | 26,942 | 67,441 | (40,499) | (60.05) | 288,240 |
| SOMALIA | 8,851 | 18,525 | (9,674) | (52.22) | 101,595 |
| SOUTH AFRICA | 23,226 | 27,386 | (4,160) | (15.19) | 212,509 |
| SOUTH KOREA | 47,580 | 68,357 | (20,777) | (30.39) | 453,278 |
| SPAIN | 17,821 | 40,098 | (22,277) | (55.56) | 198,287 |
| SRI LANKA | 17,737 | 50,185 | (32,448) | (64.66) | 124,128 |
| ST. LUCIA | 46 | 30 | 16 | 53.33 | 78 |
| SUDAN | 0 | 1,370 | (1,370) | (100.00) | 25,926 |
| SURINAME | 22 | 180 | (158) | (87.78) | 860 |
| SWEDEN | 14,125 | 13,201 | 924 | 7.00 | 103,440 |
| SWITZERLAND | 345 | 43 | 302 | 702.33 | 971 |
| SYRIA | 3,706 | 1,082 | 2,624 | 242.51 | 17,004 |
| TAIWAN | 30,769 | 28,234 | 2,535 | 8.98 | 216,338 |
| TANZANIA | 21,624 | 37,880 | (16,256) | (42.91) | 201,760 |
| TOBAGO | 0 | 21 | (21) | (100.00) | 627 |
| TOGO | 13,788 | 34,873 | (21,085) | (60.46) | 173,758 |
| TRINIDAD | 698 | 1,038 | (340) | (32.76) | 6,167 |
| TUNISIA | 0 | 3,229 | (3,229) | (100.00) | 3,337 |
| TURKEY | 70,855 | 95,600 | (24,745) | (25.88) | 615,872 |
| TURKMENISTAN | 0 | 531 | (531) | (100.00) | 1,358 |
| U.A.E | 13,561 | 11,483 | 2,078 | 18.10 | 102,158 |
| U.S.A | 65,579 | 112,382 | (46,803) | (41.65) | 540,349 |
| UGANDA | 119 | 0 | 119 | #DIV/0! | 1,246 |
| UKRAINE | 2,039 | 17,969 | (15,930) | (88.65) | 49,697 |
| UNITED KINGDOM | 1,157 | 2,844 | (1,687) | (59.32) | 15,505 |
| URUGUAY | 72 | 22 | 50 | 227.27 | 67 |
| UZBEKISTAN | 2,416 | 3,682 | (1,266) | (34.38) | 30,210 |
| VANUATU | 73 | 0 | 73 | #DIV/0! | 156 |
| VENEZUELA | 0 | 23 | (23) | (100.00) | 23 |
| VIETNAM | 37,222 | 49,454 | (12,232) | (24.73) | 436,839 |
| YEMEN ARAB REP. | 24,276 | 4,611 | 19,665 | 426.48 | 94,365 |
| OTHERS | 3,123 | 2,928 | 195 | 6.66 | 23,776 |
| TOTAL | 1,843,095 | 2,303,098 | (460,003) | (19.97) | 17,368,865 |
The Chart
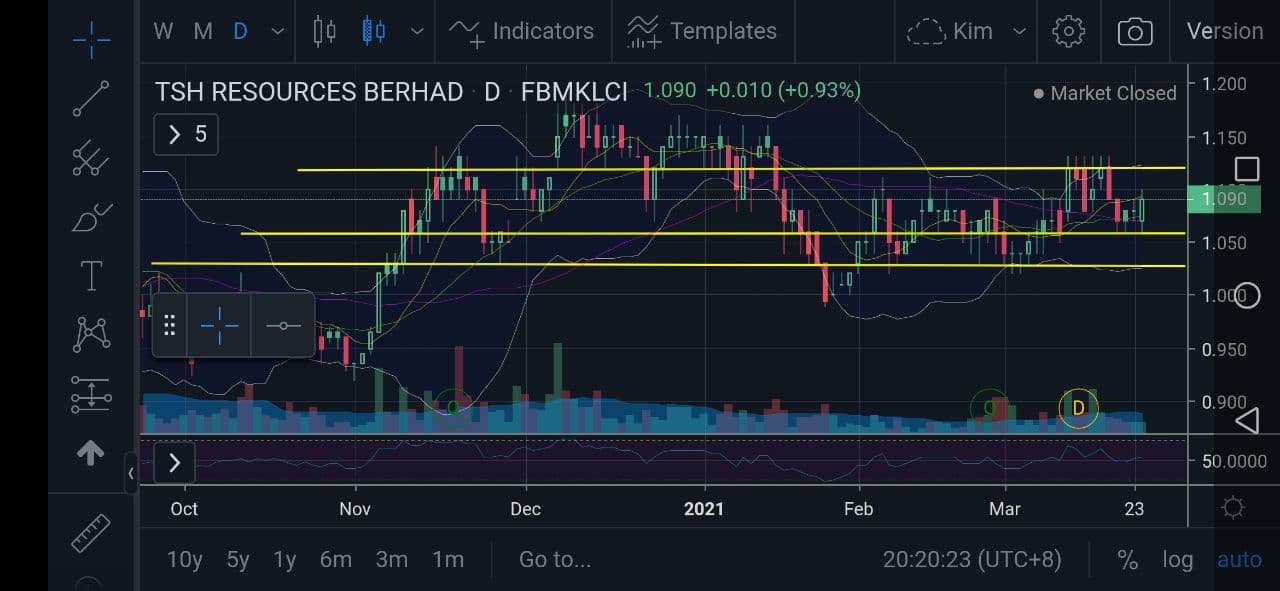
The chart's look good with all indicators showing strong signal to move anytime from now.
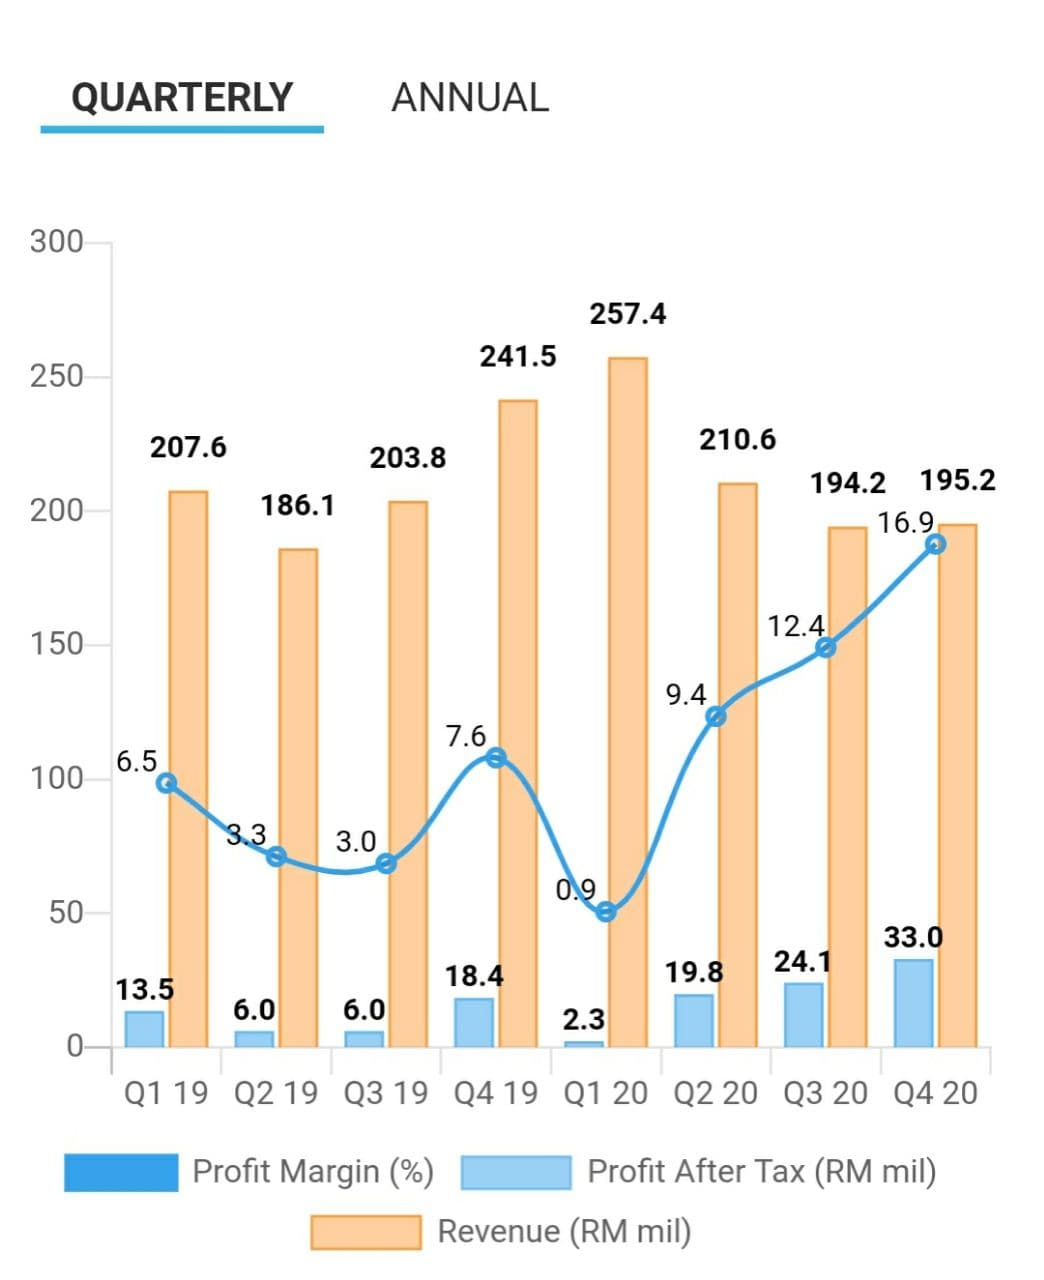
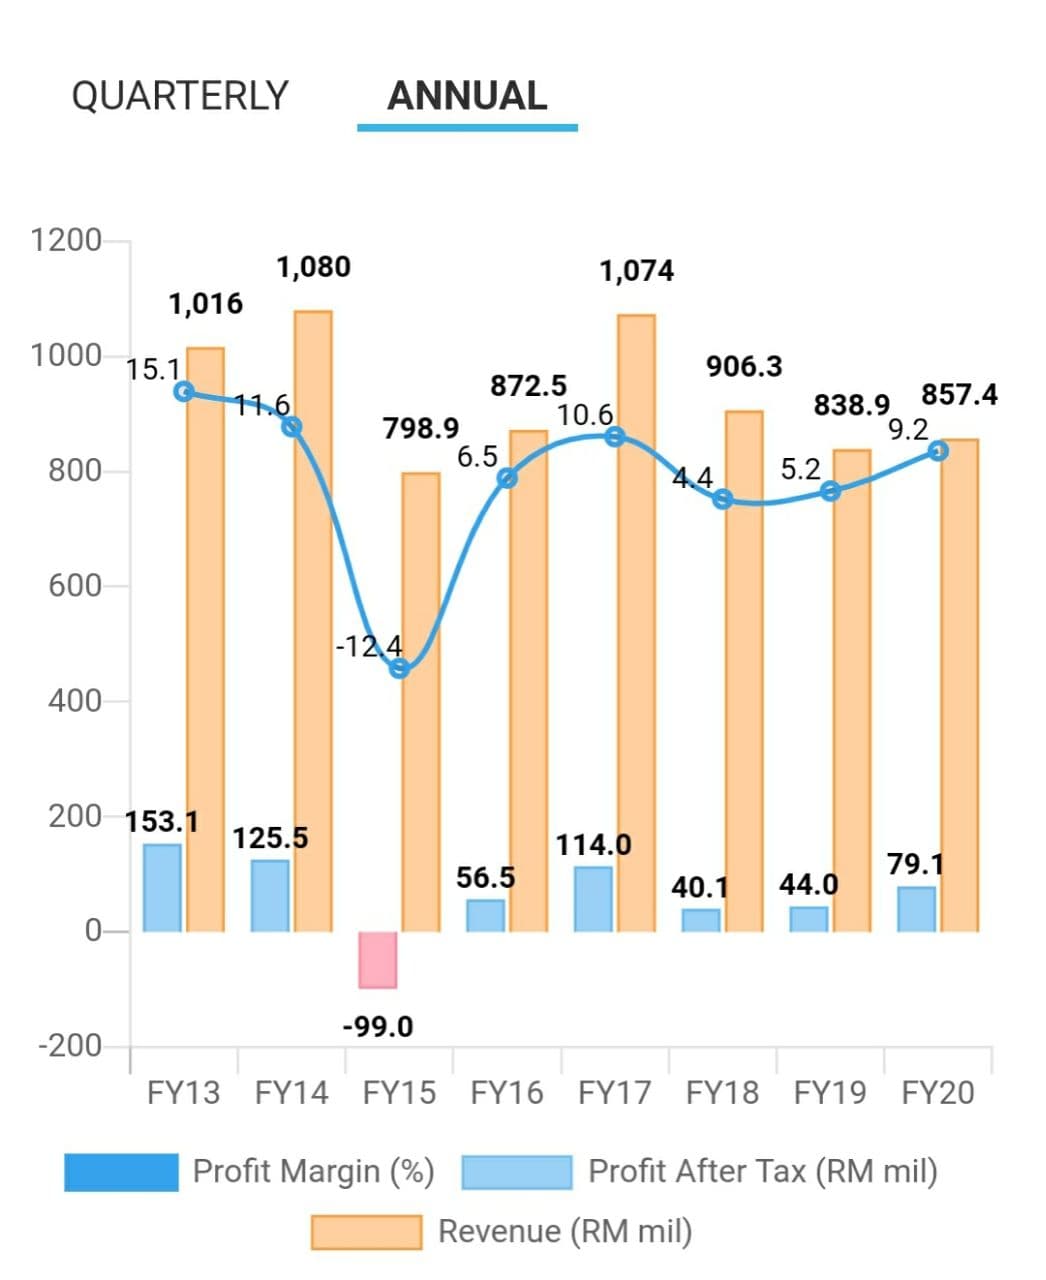
The Financial Company
 |
 |
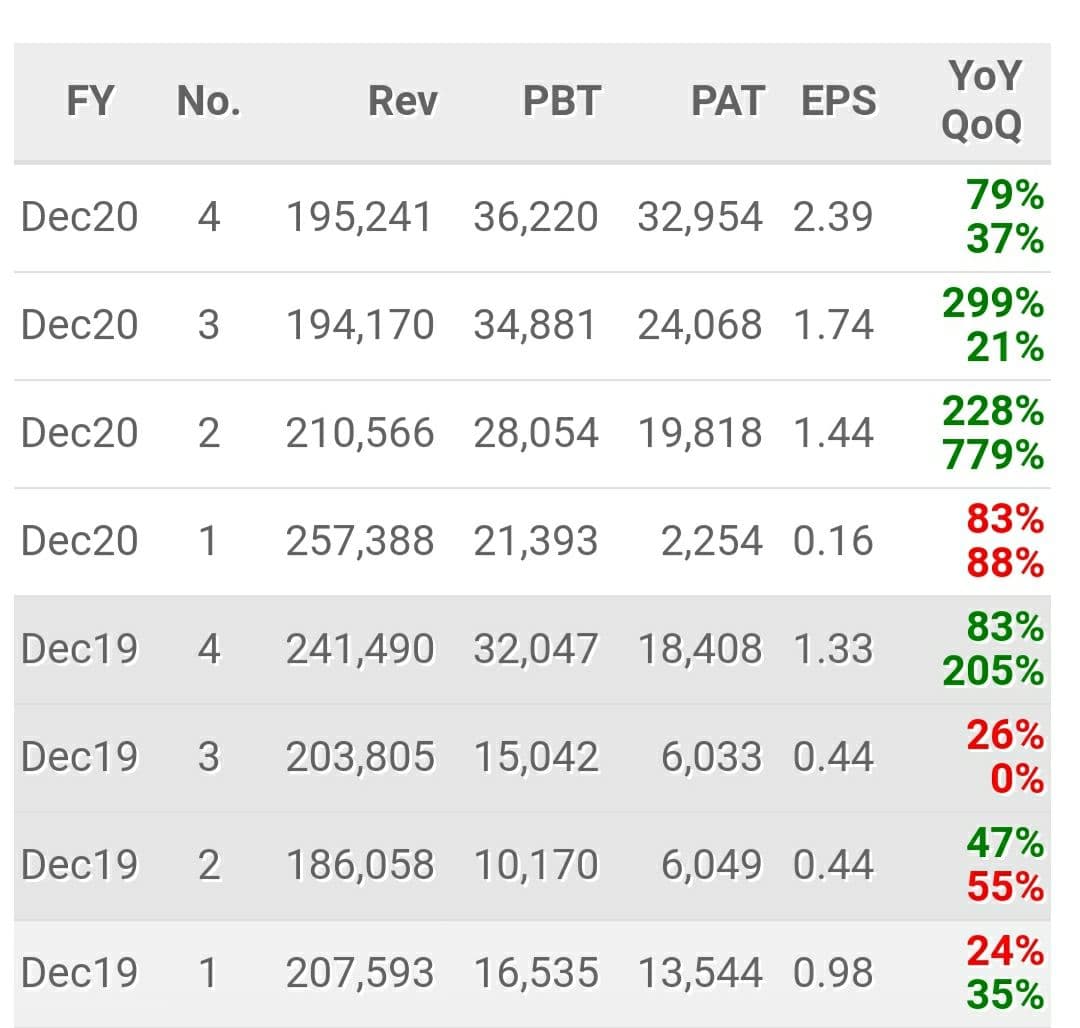
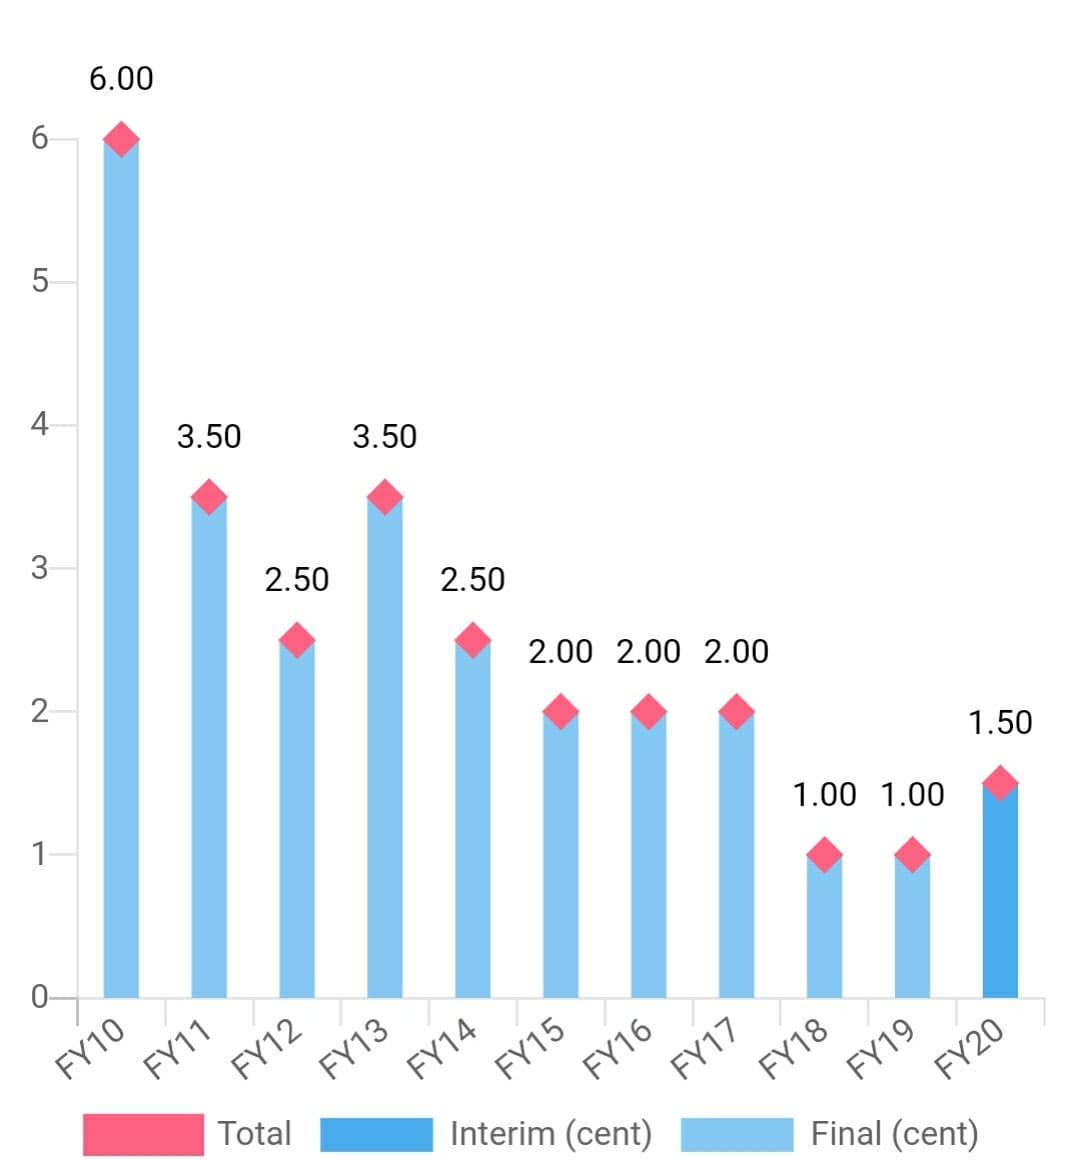
The Quater Report & Dividen
 |
 |
Lastly, don't forget to click on our telegram links and join us. Let us give you the latest update on the stock market and our group development. We hope you enjoy reading our blogs and give us your support.
If you would like to know more about Kim's Group Trader (KGT) and Kim's Investment Club (KIC). You may reach out to us via links.
LETS JOIN KIM'S STOCKWATCH GROUP?
Official Telegram : https://www.telegram.me/kimstock
Official Website : http://www.kimstockwatch.com/
Best Regards,
KIM
Disclaimers: The research, information and financial opinions expressed in this article are purely for information and educational purpose only. We do not make any recommendation for the intention of trading purposes nor is it an advice to trade. Although best efforts are made to ensure that all information is accurate and up to date, occasionally errors and misprints may occur which are unintentional. It would help if you did not rely upon the material and information. We will not be liable for any false, inaccurate, incomplete information and losses or damages suffered from your action. It would be best if you did your own research to make your personal investment decisions wisely or consult your investment advise.
Related Stocks
| Chart | Stock Name | Last | Change | Volume |
|---|
More articles on Follow Kim's Stockwatch!
MY GEMS GOING TO SKYROCKET!!! - DATA CENTER'S NEED RENEWABLE ENERGY PRODUCER
Created by sparta | Jul 12, 2024
THIS ANOTHER GEMS READY TO SKYROCKET!!! - MAJOR DEVELOPER IN PENANG
Created by sparta | May 08, 2024
THIS STOCK READY TO SKYROCKET!!! - THE POWER & WATER SUPPLY SERVICES
Created by sparta | May 07, 2024
Featured Posts
Introducing MY's First IPO Fund for Sophisticated Investors!
New Update. Discover investment communities that resonate with your ideas
M & A Value Partners IPO Equity Fund has been launched - Targeted 13% Return p.a
Latest Videos


MQ Trading Signals
Time
Signal
Duration
Type
2024-11-21 16:40:00
EMA 5
10 Mins
BUY
2024-11-21 16:40:00
ADX
10 Mins
BUY
2024-11-21 16:40:00
ADX
5 Mins
BUY
2024-11-21 16:30:00
EMA 5
10 Mins
SELL
2024-11-21 16:30:00
ADX
5 Mins
SELL
Apps


Top Articles
1
2
Good Articles to Share
3
4
Koon Yew Yin's Blog
Why all plantation companies will continue to report more profit - Koon Yew Yin
5
AmInvest Research Reports
6
7
save malaysia!
8
#
Stock
Score
Daily Stocks
Stock Name
Last
Change
Volume
Stock Name
Last
Change
Volume
Stock Name
Last
Change
Volume
Featured Advertisers / Partners


Ride The Bull Short The Bear
CS Tan
4.9 / 5.0
This book is the result of the author's many years of experience and observation throughout his 26 years in the stockbroking industry. It was written for general public to learn to invest based on facts and not on fantasies or hearsay....