


TeoCT
Hengyuan What's next

Hengyuan – what next?
Some optimist (verging on fanatic) said buy, continue to buy, BUY! All because (one year) 2017 is fantastic, high profit and high free cash-flow (with bank account bulging with close to RM 900 million), coming high PE pushing prices potentially to RM 20 to 60.
Current PE with EPS bordering RM3.30 (FY2017) is just under 5. One can do all the check ROE, etc and yes, this scream BUY!
This recent run-up in the price caused many to question whether this is sustainable?
How high can it go?
Will it make losses like 2011 to 2014 next year or the following year?
Is this Hengyuan, a Chinese state owned enterprise (SOE) reliable, is it like the many RED counters that tanked?
How about 2018 and thereafter?
Will electric vehicles kill refineries?
So many questions; so few answers.
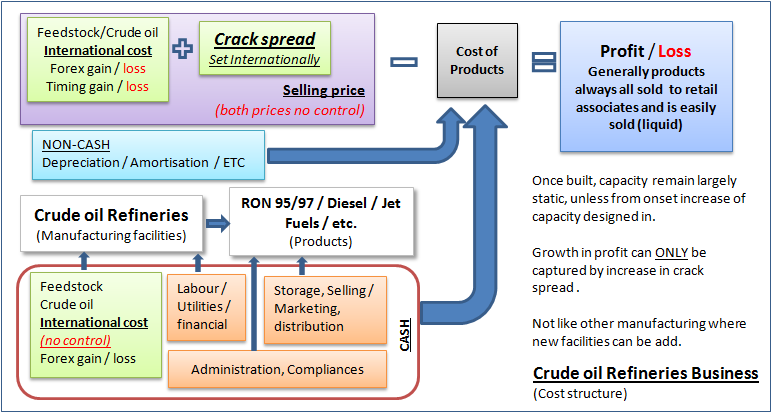
Refinery profitability is at the mercy of international market, not like other manufacturing business whereby owner can set the selling price. CRACK spread value determines the profitability of (oil) refineries.
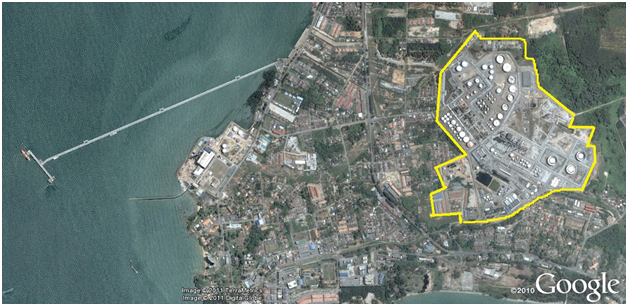
Google map show the refinery at Port Dickson
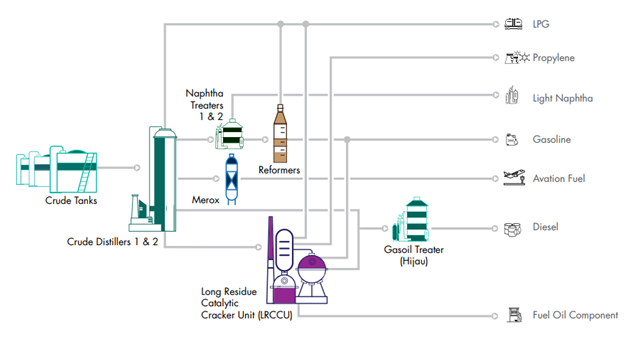
Schematic of refinery with the various equiment.
For more details of how a refinery converts crude oil to products, please visit this site https://www.eia.gov/energyexplained/index.cfm?page=oil_refining#tab1
OK let’s try to answer the many questions.
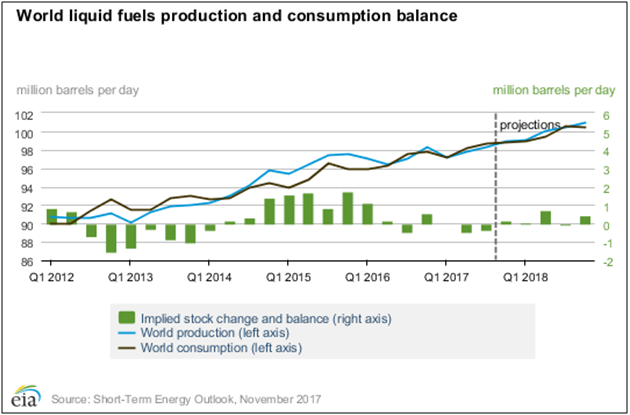
Demand from three sources is as shown in the following tables / graph.

Source – IEA (International Energy Agency)
EIA = US Energy Information Administration
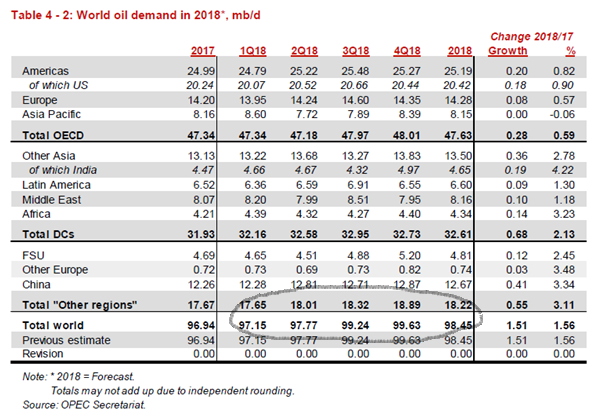
Source – OPEC Monthly Oil Market Report 13 December 2017
Firstly, demand – all 3 sources show 2018 oil consumption should be higher than 2017 – 99 mbd
Next, let’s look at refining capacity and its utilization rate.
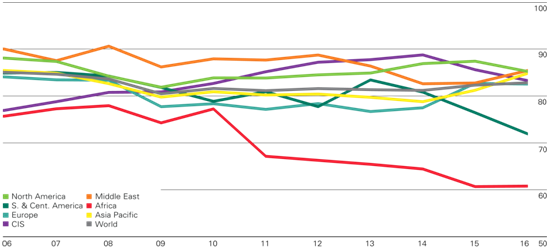
Refinery utilization: Percentage (based on average annual capacity)
Source: BP Statistical Review of World Energy 2017 © BP p.l.c. 2017
The graph shows world refineries (except Africa & L. America) are running at about 85%, this is high.
OPEC Annual Statistical Bulletin 2016 (Extract of Table)
Table 4.3: World refinery capacity by country (1,000 b/cd) (cd is calendar day)
2011 2012 2013 2014 2015 change
Total world: 94,338.0 94,784.7 94,871.7 95,810.8 96,589.0 778.2
World refining capacity is tight as per below statement:
Refining capacity worldwide will rise from 97 million barrels a day currently to 110 million by 2040, he said. The industry’s profit margins should be robust until 2023 or 2024, but may narrow after that due to potential excess capacity, he said.
(KPI Chief Executive Officer Bakheet al-Rashidi July 13, 2017) https://www.bloomberg.com/news/articles/2017-07-13/kuwait-to-boost-oil-output-capacity-from-2030-plans-refineries
It appears that current refining capacity (97mbd) just meet current demand (97mbd). And the increase in refining capacity will just about meet the increasing demand.
Secondly, current refining capacity just meet demand and utilization is high at 85% and above.
Oil refinery is complex equipment / facility, running at 85% and above for extended period will lead to higher unplanned shutdown or longer shutdown period for maintenance.
Now let us look at the important refining margin – crack spread.
Regional refining margins (US dollars per barrel)
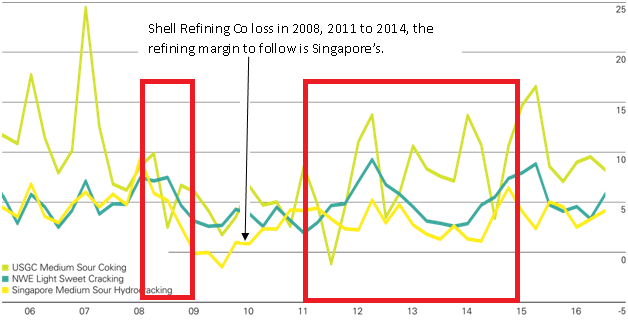
Source: BP Statistical Review of World Energy 2017 © BP p.l.c. 2017
Refining margins depend on:
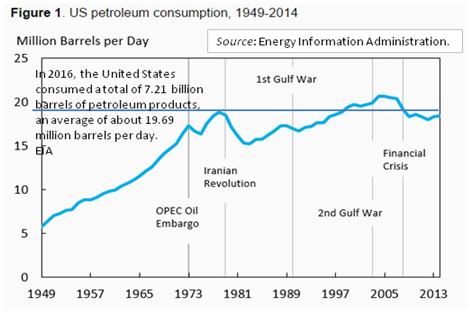
- demand (of refined products) – as oil price goes up, demand plateau or reduced, see figure 1 below.
- refining capacity – as more capacity come on-stream during reduced demand, margins dropped
The condition outlined in 1 & 2 above caused losses at SRC in the period 2011 to 2014. Loss in 2008 was due to the Great Financial Crises.
So, oil prices have been low since middle of 2014, demand of refined products have gone up and is projected to increase to 99 mbd as discussed earlier and estimated by EIA, IEA and OPEC.
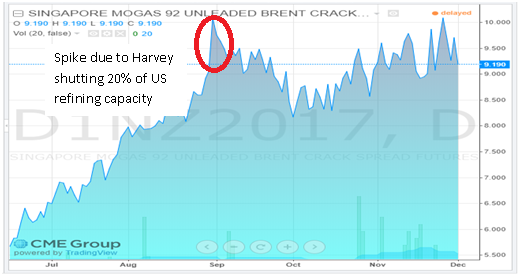
With refining capacity just meeting demand, the crack spread has been high for 2017, spiking when hurricane Harvey shut down 20% of US’s capacity as shown below.
Thirdly, refining capacity is expected to remain tight, crack spread should remain high (> USD 5/b) for 2018 till at least 2020.
Summary:
a) World oil demand for 2018 is forecasted to increase to 99 mbd by IEA, OPEC and EIA
b) Refining capacity in the world currently is 97 mbd and utilization is at 85%, this potentially lead to higher unplanned shutdown and longer maintenance period.
c) Refining margins (crack spread) is a function of demand (of refined products) and available refining capacity. Any outage of capacity (see b) above) will cause the crack spread to spike like that caused by hurricane Harvey in September.
d) It is expected with capacity just meeting demand for the next few years, crack spread is expected to remain high.
Oil price remaining low (< USD 80 /barrel) appear to be the case for the coming few years. Looking at oil consumption in USA, demand of refined products start to reduce once pump price become too high.
Sustainability of crack spreads should ensure Hengyuan continue to make profit next year to 2020 conservatively as compared with 2023 / 2024 as mentioned by KPI CEO.
Next installment, I will look at the valuation of Hengyuan under the above scenarios.
Related Stocks
| Chart | Stock Name | Last | Change | Volume |
|---|
More articles on TeoCT
The Great American Firewall: On the Question of Censorship by Danny Haiphong
Created by teoct | Jul 23, 2020
Discussions
5 people like this. Showing 17 of 17 comments
i salute you greatly for providing comprehensive and useful data on oil. thx
2017-12-20 20:41
thanks for sharing. very informative. looking foward your next article on HY
2017-12-20 21:40
btw, the human quest in attempt to replace oil with renewable energy is as early as the 90s. From the solar burst, and now the electric cars, one needs to think hard concerning the near prospect of refinery as most of its product caters toward the transportation.
As of now, petrol-run vehicles still prove to be economical and, in fact, less carbon emission compared to that of electric car manufacturing. We'll also need to look into governmental pressure in imposing limitation upon the refineries should they decide to go full green. But full green now is enonomically not feasible, nor justifiable. Think Tesla.
2017-12-21 07:22
This stock is the next press metal and Hengyuan!
https://klse.i3investor.com/blogs/huathuathuat/142046.jsp
2017-12-21 10:50
stockswizard This stock is the next press metal and Hengyuan!
https://klse.i3investor.com/blogs/huathuathuat/142046.jsp
21/12/2017 10:50
Looking on aluminium by pressmetal... i can see Arank is better choice, can compare revenue n profit between pmetal,arank and pmbtech... pmbtech already RM3+...Arank need some little profit to boost and follow pmbtech ...then chasing Pmetal of course
2017-12-21 17:46
and what if all the money that is made goes to China and none for you miserable minorities in Malaysia?
2017-12-21 17:52
plus the fact this is an old plant without depreciation........low PE during cyclical high earnings is to be expected.
2017-12-21 17:54
Average Pe of refinery
1. USA PE 20x
2. Europe 9.5x
3. Asia 12.5x
Pe of msia
1. Petdag 20x
2. Petron 8.5x
3. Hengyuan 5x
Thus fair PE for hengyuan should be 7.5x loh....!!
EPS rm 3.10 loh...!!
Thus fair value of Hengyuan Rm 22.00 Pe 7.5x, this PE is still below asia average of 12.5x mah....!!
Remember Warren Buffet invest in usa refinery Philip 66 which has Pe 24x loh....!!
Just imagine hengyuan TP PE 7.5x is still much lower than Philip66 Pe 24x loh....!!
Thus opportunity to profit from hengyuan loh....!!
2017-12-22 23:51
U must understand 9 out of 3 directors are msian , this are experience directors majority from hong leong who do not want to take risk loh..!!
Have confidence loh....!!
Posted by brightsmart > Dec 21, 2017 05:52 PM | Report Abuse
and what if all the money that is made goes to China and none for you miserable minorities in Malaysia?
2017-12-22 23:53
Post a Comment
Featured Posts
Introducing MY's First IPO Fund for Sophisticated Investors!
New Update. Discover investment communities that resonate with your ideas
M & A Value Partners IPO Equity Fund has been launched - Targeted 13% Return p.a
Latest Videos


MQ Trading Signals
Time
Signal
Duration
Type
2024-11-22 15:30:00
EMA 5
10 Mins
SELL
2024-11-22 15:00:00
EMA 5
5 Mins
SELL
2024-11-22 11:10:00
EMA 5
10 Mins
BUY
2024-11-22 11:10:00
EMA 5
5 Mins
BUY
2024-11-22 11:00:00
EMA 5
30 Mins
BUY
Apps


Top Articles
1
Koon Yew Yin's Blog
2
3
Good Articles to Share
4
Koon Yew Yin's Blog
Why all plantation companies will continue to report more profit - Koon Yew Yin
5
6
Mercury Securities Research
7
8
AmInvest Research Reports
#
Stock
Score
Daily Stocks
Stock Name
Last
Change
Volume
Stock Name
Last
Change
Volume
Stock Name
Last
Change
Volume
Featured Advertisers / Partners


Ride The Bull Short The Bear
CS Tan
4.9 / 5.0
This book is the result of the author's many years of experience and observation throughout his 26 years in the stockbroking industry. It was written for general public to learn to invest based on facts and not on fantasies or hearsay....
Equityengineer
Can add capacity but expensive. Many will shy away to build extra capacity rather improve efficiency.Besides that only complex type of refineries would be viable in future. In that case no of refineries will decline. The refined crack spread will go up since less capability to produce refinery.
There is many challenges for renewable/clan energy to take over refined product, and definitely till 2020 refined crude oil and gas plays major role in industry and maintaining the energy in the world.
Good sharing on outlook of demand.
2017-12-20 20:27