Trading With A View
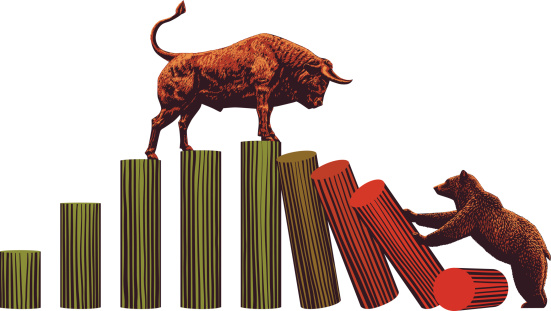
For The Greater Bull or Bear ?
tradeview
Publish date: Tue, 19 Jul 2016, 04:15 PM

Dear fellow readers,
Once again, these writings are just my humble highlights (not recommendation), feel free to have some intellectual discourse on this. To join my telegram channel : https://telegram.me/tradeview101 or Email me at: tradeview101@gmail.com
_____________________________________________________________________________
On Friday, 8th July, the US Jobs Data figures announced as the following :
Non-Farm Payroll (June) - 287k
Unemplyoment Rate (June) - 4.9%
Labor Force Participation Rate - 62.7%
Average Hourly Earnings - 0.1%
These are all strong solid numbers. What do all these numbers represent? Does it indicate a bull run or an alarm bell? Following the announcement of these numbers, Dow jump 1.4% (250 points) and S&P500 1.5% (32 points). So logically, it would mean that the market reacted positively to this.
However, please look closely between the other key numbers. Gold also move up in tandem 0.4% and the US Bond 2 year treasury yield moved up 0.5%. What do all these metrics tell you? I know it seems confusing as the signals are mixed. Same for me, I have a tough time comprehending the true direction of the market. However, there should be a compass within you when deciding whether to take a position. Otherwise, staying sideline is safer. Do not venture aimlessly.
There are a few simple questions one can ask oneself when considering whether to side the Bull or the Bear. Below are a few simple but useful tools to rely on.
1. Overall Fundamental of Economy (Both Global and Domestic)
Paying attention to the report by Central Banks on key data figures such as GDP growth, unemployment rate, PMI, Interest rate, Current Account balance, Foreign reserves etc are paramount in understanding the fundamentals of an economy. The ability to recognise these data figures will help one see the market movements in the mid to long term. It also helps one predict the policy makers next move if one is able to read the potential policy changes. A simple example, BNM recent rate cut from 3.25% to 3% shows a movement by policy makers to address the growing concern on the country's slowing growth and inflation numbers.

On the surface, rate cut would seem like a boost for the economy by spurring spending and investment activities. However, the fact that BNM had to consider using rate cut shows that the underlying economic strength of Malaysia is not as strong as the targets set by Govt appears to be unattainable without some measures being taken. In the short term, maybe the markets will be rejuvenated.
However, in the long run, the effect will weak off unless there is under stimulus packages or fiscal policies being derived to help spur growth. In my personal opinion, the market going through some level of consolidation is healthy and definitely will help sustain the economy. Growth cannot be perpetual. So long as the basic economic framework is there, the health of the economy will return once there is true demand (Aggregate Demand). The only question is when?
2. Price and movement of safe havens (Like Gold and Yen)
Usually in times of extreme volatility, value of Gold appreciates. In the past during war time, Gold becomes immensely valuable as the value of paper money erodes. In the past, currency are peg to gold bullions to define its value. Of course, this is no longer the case. But the safe haven characteristic of Gold is still there. Lets use a simple recent example that all can relate to, Brexit. During Brexit announcement, the value of Gold shot up significantly. Word on the street is Soros made a killing in the Gold Market although he Long GBP in favour of bremain. The chart as below :

Again, during Brexit announcement, the Yen rallied and even broke 100 to USD. Yen is a currency safe haven naturally in the FOREX world and this is largely due to their national huge savings. The chart as below :

Therefore, whenever the market is moving downwards, the signals can be seen in the forex market as well as a form of safe havens. The Gold and the Yen is a good indicator.
3. Market Sentiment, Consumer Confidence and Expectation
When you go to the coffeeshop, mamak, Pasar or local kedai runcit, have you come across conversations like this "Economy v bad, have to save" or "Business slow la, this year very bad"? What about conversations like this "Wah, market very good, I made so much money man, can buy new car and new house". Comparing both sort of conversations, I think most of us only hear the first version. Of course, in public, people are less likely to brag but I believe there is always some truth to these chatters as wealth often flows from the top to the bottom. On the ground research is always good and reliable because you feel the sentiment of the people on the ground, be it store keepers, sales people and what not. The easiest way to know whether the particular sector is doing well is to approach the operations people working daily at that position. Ex: Speak to real estate agents or agents selling properties at the property fair and see the response to understand if the Property counters would do well, speak to clothing retailers store keepers to check why they are clearing so often, speak to car salesmen at the sales gallery to know the booking number for that Toyota or BMW. The list goes on. Once you get the general market consensus, you can start doing your own forecast on that particular sector. Cross check the information and I think you dont need analyst report to have a rough indicator on the outlook.
4. Global and domestic policies (Fiscal / Monetary)
It is quite clear that policy makers can shake the financial market be it Central Bankers or Politicians. If you have great policy maker with the foresight to implement the right policies for financial market. Example, David Cameron action of bringing on the referendum to UK citizens whether to stay or leave EU led to Brexit ultimately and caused a turmoil in the entire financial market. Another example, Draghi or Kuroda decision on easing for EU and Japan whether through -ve interest rate or stimulus packages affects the money flow in the financial market. Should they beat the market expectation on rate cut or stimulus package, chances are the equities market will rally.

5. Yield or Returns (Bond Market)
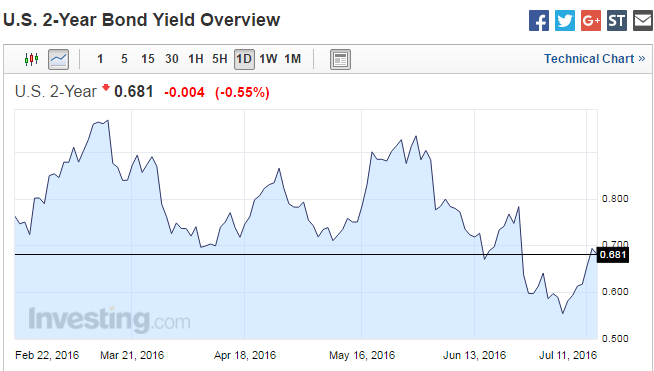
The bond market provides a good indicator as to the movement of the market. Let's take US 2 Years Yield as example. The yield of bonds move inverse to the price. If Fed were to proceed to hike interest rate, the price of bond will fall and the yield will rise as money would flow out from bond purchase. This would mean, higher interest rate would lead to higher yield for bonds but the demand is lesser resulting in the fall in bond price.
If Fed do not hike rate, funds will buy more bonds and the yield will continue to fall as price of bonds increase. Hence, observing the movement trend of bond markets may provide a high level indication as to the movement of money flow in the money market.

Non-Farm Payroll (June) - 287k
Unemplyoment Rate (June) - 4.9%
Labor Force Participation Rate - 62.7%
Average Hourly Earnings - 0.1%
These are all strong solid numbers. What do all these numbers represent? Does it indicate a bull run or an alarm bell? Following the announcement of these numbers, Dow jump 1.4% (250 points) and S&P500 1.5% (32 points). So logically, it would mean that the market reacted positively to this.
However, please look closely between the other key numbers. Gold also move up in tandem 0.4% and the US Bond 2 year treasury yield moved up 0.5%. What do all these metrics tell you? I know it seems confusing as the signals are mixed. Same for me, I have a tough time comprehending the true direction of the market. However, there should be a compass within you when deciding whether to take a position. Otherwise, staying sideline is safer. Do not venture aimlessly.
There are a few simple questions one can ask oneself when considering whether to side the Bull or the Bear. Below are a few simple but useful tools to rely on.
1. Overall Fundamental of Economy (Both Global and Domestic)
Paying attention to the report by Central Banks on key data figures such as GDP growth, unemployment rate, PMI, Interest rate, Current Account balance, Foreign reserves etc are paramount in understanding the fundamentals of an economy. The ability to recognise these data figures will help one see the market movements in the mid to long term. It also helps one predict the policy makers next move if one is able to read the potential policy changes. A simple example, BNM recent rate cut from 3.25% to 3% shows a movement by policy makers to address the growing concern on the country's slowing growth and inflation numbers.
Inflation was lower as the impact from the Goods and Services Tax (GST) implemented in April 2015 lapsed and is expected to remain stable in an environment of low global energy and commodity prices and generally subdued global inflation.
Consequently, inflation is projected to be lower at 2% to 3% in 2016, compared to an earlier projection of 2.5% to 3.5%, and continue to remain stable in 2017.. 
On the surface, rate cut would seem like a boost for the economy by spurring spending and investment activities. However, the fact that BNM had to consider using rate cut shows that the underlying economic strength of Malaysia is not as strong as the targets set by Govt appears to be unattainable without some measures being taken. In the short term, maybe the markets will be rejuvenated.
However, in the long run, the effect will weak off unless there is under stimulus packages or fiscal policies being derived to help spur growth. In my personal opinion, the market going through some level of consolidation is healthy and definitely will help sustain the economy. Growth cannot be perpetual. So long as the basic economic framework is there, the health of the economy will return once there is true demand (Aggregate Demand). The only question is when?
2. Price and movement of safe havens (Like Gold and Yen)
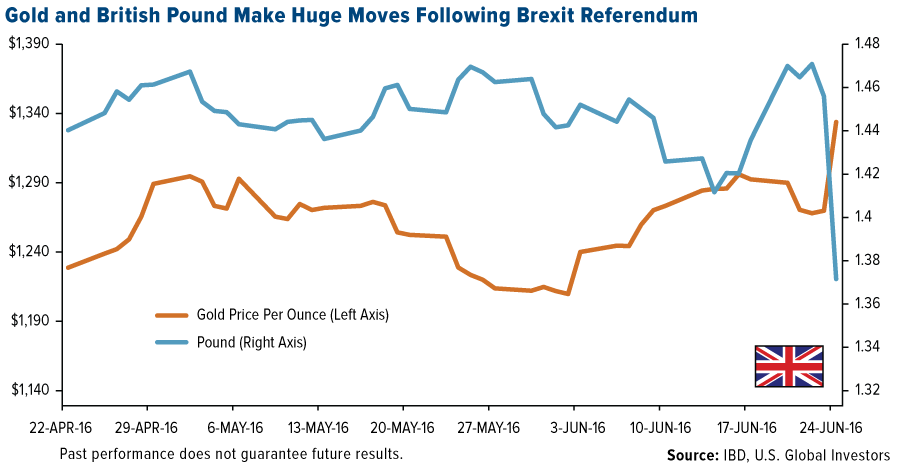
Usually in times of extreme volatility, value of Gold appreciates. In the past during war time, Gold becomes immensely valuable as the value of paper money erodes. In the past, currency are peg to gold bullions to define its value. Of course, this is no longer the case. But the safe haven characteristic of Gold is still there. Lets use a simple recent example that all can relate to, Brexit. During Brexit announcement, the value of Gold shot up significantly. Word on the street is Soros made a killing in the Gold Market although he Long GBP in favour of bremain. The chart as below :

Again, during Brexit announcement, the Yen rallied and even broke 100 to USD. Yen is a currency safe haven naturally in the FOREX world and this is largely due to their national huge savings. The chart as below :

Therefore, whenever the market is moving downwards, the signals can be seen in the forex market as well as a form of safe havens. The Gold and the Yen is a good indicator.
3. Market Sentiment, Consumer Confidence and Expectation
When you go to the coffeeshop, mamak, Pasar or local kedai runcit, have you come across conversations like this "Economy v bad, have to save" or "Business slow la, this year very bad"? What about conversations like this "Wah, market very good, I made so much money man, can buy new car and new house". Comparing both sort of conversations, I think most of us only hear the first version. Of course, in public, people are less likely to brag but I believe there is always some truth to these chatters as wealth often flows from the top to the bottom. On the ground research is always good and reliable because you feel the sentiment of the people on the ground, be it store keepers, sales people and what not. The easiest way to know whether the particular sector is doing well is to approach the operations people working daily at that position. Ex: Speak to real estate agents or agents selling properties at the property fair and see the response to understand if the Property counters would do well, speak to clothing retailers store keepers to check why they are clearing so often, speak to car salesmen at the sales gallery to know the booking number for that Toyota or BMW. The list goes on. Once you get the general market consensus, you can start doing your own forecast on that particular sector. Cross check the information and I think you dont need analyst report to have a rough indicator on the outlook.
4. Global and domestic policies (Fiscal / Monetary)
It is quite clear that policy makers can shake the financial market be it Central Bankers or Politicians. If you have great policy maker with the foresight to implement the right policies for financial market. Example, David Cameron action of bringing on the referendum to UK citizens whether to stay or leave EU led to Brexit ultimately and caused a turmoil in the entire financial market. Another example, Draghi or Kuroda decision on easing for EU and Japan whether through -ve interest rate or stimulus packages affects the money flow in the financial market. Should they beat the market expectation on rate cut or stimulus package, chances are the equities market will rally.

5. Yield or Returns (Bond Market)
The bond market provides a good indicator as to the movement of the market. Let's take US 2 Years Yield as example. The yield of bonds move inverse to the price. If Fed were to proceed to hike interest rate, the price of bond will fall and the yield will rise as money would flow out from bond purchase. This would mean, higher interest rate would lead to higher yield for bonds but the demand is lesser resulting in the fall in bond price.
If Fed do not hike rate, funds will buy more bonds and the yield will continue to fall as price of bonds increase. Hence, observing the movement trend of bond markets may provide a high level indication as to the movement of money flow in the money market.

To join my telegram channel : https://telegram.me/tradeview101
Email me at : tradeview101@gmail.com
Food for thought:

More articles on Trading With A View
NST Business x Tradeview No.3 - Adam Yeap, Owner of 212 Hospitality and co-founder of Wonderbrew
Created by tradeview | Oct 18, 2021
NST Business x Tradeview No.2 - Muzahid Shah, CEO of SteerQuest Sdn. Bhd.
Created by tradeview | Sep 28, 2021
News Straits Times Business x Tradeview - Sharing Stories of Retail Investors & the Stock Market
Created by tradeview | Sep 15, 2021
Tradeview (2021) - Peterlabs Holdings Berhad Long Term Value Stock (Update)
Created by tradeview | Jun 01, 2021
Tradeview Commentaries - The Glove Surge, A Mirage or A Path To Oasis?
Created by tradeview | Apr 08, 2021
(Tradeview 2021) - Are Research Analysts' Reports Worth Their Salt?
Created by tradeview | Mar 17, 2021
Discussions
Be the first to like this. Showing 0 of 0 comments


